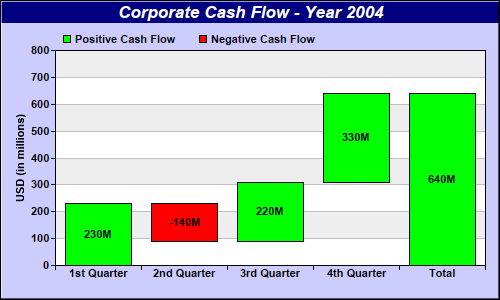
This example demonstrates a waterfall chart with positive and negative data shown in different colors.
This chart is created as a box-whisker layer using
XYChart.addBoxWhiskerLayer. Only the "box" part of the box-whisker layer is used.
The top-edges of the boxes are obtained by accumulating the raw data using the
ArrayMath utility. The bottom-edges of the boxes are simply the top-edges of previous boxes, with the exception of the last "total" box which always starts at 0.
The color for each box is set using
BoxWhiskerLayer.setBoxColor, in which the color depends on whether the top-edge is above or below the bottom-edge (that is, whether the data is positive or negative).
[Web Version (in ASP)] aspdemo\posnegwaterfall.asp
<%@ language="vbscript" %>
<%
Set cd = CreateObject("ChartDirector.API")

' 4 data points to represent the cash flow for the Q1 - Q4
data = Array(230, -140, 220, 330)

' We want to plot a waterfall chart showing the 4 quarters as well as the total
labels = Array("1st Quarter", "2nd Quarter", "3rd Quarter", "4th Quarter", "Total")

' The top side of the bars in a waterfall chart is the accumulated data. We use the ChartDirector
' ArrayMath utility to accumulate the data. The "total" is handled by inserting a zero point at the
' end before accumulation (after accumulation it will become the total).
boxTop = cd.ArrayMath(data).insert2(0, 1, UBound(data) + 1).acc().result()

' The botom side of the bars is just the top side of the previous bar. So we shifted the top side
' data to obtain the bottom side data.
boxBottom = cd.ArrayMath(boxTop).shift(1, 0).result()

' The last point (total) is different. Its bottom side is always 0.
boxBottom(UBound(boxBottom)) = 0

' In this example, we want to use different colors depending on the data is positive or negative.
posColor = &H00ff00
negColor = &Hff0000

' Create a XYChart object of size 500 x 280 pixels. Set background color to light blue (ccccff),
' with 1 pixel 3D border effect.
Set c = cd.XYChart(500, 300, &Hccccff, &H000000, 1)

' Add a title to the chart using 13 points Arial Bold Itatic font, with white (ffffff) text on a
' deep blue (0x80) background
Call c.addTitle("Corporate Cash Flow - Year 2004", "Arial Bold Italic", 13, &Hffffff _
    ).setBackground(&H000080)

' Set the plotarea at (55, 50) and of size 430 x 215 pixels. Use alternative white/grey background.
Call c.setPlotArea(55, 50, 430, 215, &Hffffff, &Heeeeee)

' Add a legend box at (55, 25) using 8pt Arial Bold font with horizontal layout, with transparent
' background and border color.
Set b = c.addLegend(55, 25, False, "Arial Bold", 8)
Call b.setBackground(cd.Transparent, cd.Transparent)

' Add keys to show the colors for positive and negative cash flows
Call b.addKey("Positive Cash Flow", posColor)
Call b.addKey("Negative Cash Flow", negColor)

' Set the labels on the x axis using Arial Bold font
Call c.xAxis().setLabels(labels).setFontStyle("Arial Bold")

' Set the x-axis ticks and grid lines to be between the bars
Call c.xAxis().setTickOffset(0.5)

' Use Arial Bold as the y axis label font
Call c.yAxis().setLabelStyle("Arial Bold")

' Add a title to the y axis
Call c.yAxis().setTitle("USD (in millions)")

' Add a box-whisker layer to represent the waterfall bars
Set layer = c.addBoxWhiskerLayer(boxTop, boxBottom)

' Color the bars depending on whether it is positive or negative
For i = 0 To UBound(boxTop)
    If boxTop(i) >= boxBottom(i) Then
        Call layer.setBoxColor(i, posColor)
    Else
        Call layer.setBoxColor(i, negColor)
    End If
Next

' Put data labels on the bars to show the cash flow using Arial Bold font
Call layer.setDataLabelFormat("{={top}-{bottom}}M")
Call layer.setDataLabelStyle("Arial Bold").setAlignment(cd.Center)

' Output the chart
Set viewer = cd.WebChartViewer(Request, "chart1")
Call viewer.setChart(c, cd.SVG)

' Include tool tip for the chart
viewer.ImageMap = c.getHTMLImageMap("", "", "title='{xLabel}: {={top}-{bottom}} millions'")
%>

<!DOCTYPE html>
<html>
<head>
    <title>Pos/Neg Waterfall Chart</title>
    <!-- Include ChartDirector Javascript Library to support chart interactions -->
    <script type="text/javascript" src="cdjcv.js"></script>
</head>
<body style="margin:5px 0px 0px 5px">
    <div style="font:bold 18pt verdana;">
        Pos/Neg Waterfall Chart
    </div>
    <hr style="border:solid 1px #000080; background:#000080" />
    <div style="font:10pt verdana; margin-bottom:1.5em">
        <a href="viewsource.asp?file=<%= Request("SCRIPT_NAME") %>">View Chart Source Code</a>
    </div>
    <!-- ****** Here is the chart image ****** -->
    <%= viewer.renderHTML() %>
</body>
</html>
[Windows Version (in Visual Basic)] vbdemo\posnegwaterfall.cls
Public Sub createChart(viewer As Object, chartIndex As Integer)

    Dim cd As New ChartDirector.API

    ' 4 data points to represent the cash flow for the Q1 - Q4
    Dim data()
    data = Array(230, -140, 220, 330)

    ' We want to plot a waterfall chart showing the 4 quarters as well as the total
    Dim labels()
    labels = Array("1st Quarter", "2nd Quarter", "3rd Quarter", "4th Quarter", "Total")

    ' The top side of the bars in a waterfall chart is the accumulated data. We use the
    ' ChartDirector ArrayMath utility to accumulate the data. The "total" is handled by inserting a
    ' zero point at the end before accumulation (after accumulation it will become the total).
    Dim boxTop()
    boxTop = cd.ArrayMath(data).insert2(0, 1, UBound(data) + 1).acc().result()

    ' The botom side of the bars is just the top side of the previous bar. So we shifted the top
    ' side data to obtain the bottom side data.
    Dim boxBottom()
    boxBottom = cd.ArrayMath(boxTop).shift(1, 0).result()

    ' The last point (total) is different. Its bottom side is always 0.
    boxBottom(UBound(boxBottom)) = 0

    ' In this example, we want to use different colors depending on the data is positive or
    ' negative.
    Dim posColor As Long
    posColor = &H00ff00
    Dim negColor As Long
    negColor = &Hff0000

    ' Create a XYChart object of size 500 x 280 pixels. Set background color to light blue (ccccff),
    ' with 1 pixel 3D border effect.
    Dim c As XYChart
    Set c = cd.XYChart(500, 300, &Hccccff, &H000000, 1)

    ' Add a title to the chart using 13 points Arial Bold Itatic font, with white (ffffff) text on a
    ' deep blue (0x80) background
    Call c.addTitle("Corporate Cash Flow - Year 2004", "arialbi.ttf", 13, &Hffffff).setBackground( _
        &H000080)

    ' Set the plotarea at (55, 50) and of size 430 x 215 pixels. Use alternative white/grey
    ' background.
    Call c.setPlotArea(55, 50, 430, 215, &Hffffff, &Heeeeee)

    ' Add a legend box at (55, 25) using 8pt Arial Bold font with horizontal layout, with
    ' transparent background and border color.
    Dim b As LegendBox
    Set b = c.addLegend(55, 25, False, "arialbd.ttf", 8)
    Call b.setBackground(cd.Transparent, cd.Transparent)

    ' Add keys to show the colors for positive and negative cash flows
    Call b.addKey("Positive Cash Flow", posColor)
    Call b.addKey("Negative Cash Flow", negColor)

    ' Set the labels on the x axis using Arial Bold font
    Call c.xAxis().setLabels(labels).setFontStyle("arialbd.ttf")

    ' Set the x-axis ticks and grid lines to be between the bars
    Call c.xAxis().setTickOffset(0.5)

    ' Use Arial Bold as the y axis label font
    Call c.yAxis().setLabelStyle("arialbd.ttf")

    ' Add a title to the y axis
    Call c.yAxis().setTitle("USD (in millions)")

    ' Add a box-whisker layer to represent the waterfall bars
    Dim layer As BoxWhiskerLayer
    Set layer = c.addBoxWhiskerLayer(boxTop, boxBottom)

    ' Color the bars depending on whether it is positive or negative
    Dim i As Long
    For i = 0 To UBound(boxTop)
        If boxTop(i) >= boxBottom(i) Then
            Call layer.setBoxColor(i, posColor)
        Else
            Call layer.setBoxColor(i, negColor)
        End If
    Next

    ' Put data labels on the bars to show the cash flow using Arial Bold font
    Call layer.setDataLabelFormat("{={top}-{bottom}}M")
    Call layer.setDataLabelStyle("arialbd.ttf").setAlignment(cd.Center)

    ' Output the chart
    Set viewer.Picture = c.makePicture()

    'include tool tip for the chart
    viewer.ImageMap = c.getHTMLImageMap("clickable", "", _
        "title='{xLabel}: {={top}-{bottom}} millions'")

End Sub
© 2021 Advanced Software Engineering Limited. All rights reserved.