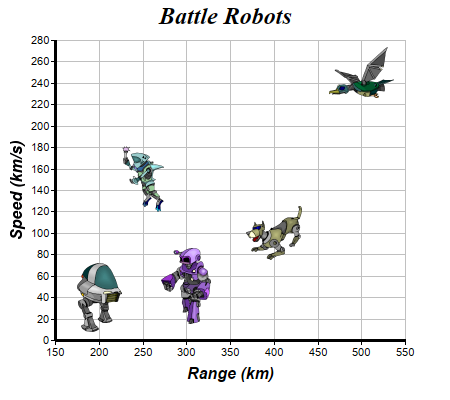
This example demonstrates using external image files as scatter symbols.
The chart in this example is created as 5 scatter layers using
XYChart.addScatterLayer, with each layer containing one point.
The symbols for the scatter layers come from external image files. They are loaded using
DataSet.setDataSymbol2.
[Web Version (in ASP)] aspdemo\scattersymbols.asp
<%@ language="vbscript" %>
<%
Set cd = CreateObject("ChartDirector.API")

' The XY points for the scatter chart
dataX = Array(200, 400, 300, 250, 500)
dataY = Array(40, 100, 50, 150, 250)

' The custom symbols for the points
symbols = Array("robot1.png", "robot2.png", "robot3.png", "robot4.png", "robot5.png")

' Create a XYChart object of size 450 x 400 pixels
Set c = cd.XYChart(450, 400)

' Set the plotarea at (55, 40) and of size 350 x 300 pixels, with a light grey border (0xc0c0c0).
' Turn on both horizontal and vertical grid lines with light grey color (0xc0c0c0)
Call c.setPlotArea(55, 40, 350, 300, -1, -1, &Hc0c0c0, &Hc0c0c0, -1)

' Add a title to the chart using 18pt Times Bold Itatic font.
Call c.addTitle("Battle Robots", "Times New Roman Bold Italic", 18)

' Add a title to the y axis using 12pt Arial Bold Italic font
Call c.yAxis().setTitle("Speed (km/s)", "Arial Bold Italic", 12)

' Add a title to the y axis using 12pt Arial Bold Italic font
Call c.xAxis().setTitle("Range (km)", "Arial Bold Italic", 12)

' Set the axes line width to 3 pixels
Call c.xAxis().setWidth(3)
Call c.yAxis().setWidth(3)

' Add each point of the data as a separate scatter layer, so that they can have a different symbol
For i = 0 To UBound(dataX)
    Call c.addScatterLayer(Array(dataX(i)), Array(dataY(i))).getDataSet(0).setDataSymbol2( _
        Server.MapPath(symbols(i)))
Next

' Output the chart
Set viewer = cd.WebChartViewer(Request, "chart1")
Call viewer.setChart(c, cd.SVG)

' Include tool tip for the chart
viewer.ImageMap = c.getHTMLImageMap("", "", "title='Range = {x} km, Speed = {value} km/s'")
%>

<!DOCTYPE html>
<html>
<head>
    <title>Custom Scatter Symbols</title>
    <!-- Include ChartDirector Javascript Library to support chart interactions -->
    <script type="text/javascript" src="cdjcv.js"></script>
</head>
<body style="margin:5px 0px 0px 5px">
    <div style="font:bold 18pt verdana;">
        Custom Scatter Symbols
    </div>
    <hr style="border:solid 1px #000080; background:#000080" />
    <div style="font:10pt verdana; margin-bottom:1.5em">
        <a href="viewsource.asp?file=<%= Request("SCRIPT_NAME") %>">View Chart Source Code</a>
    </div>
    <!-- ****** Here is the chart image ****** -->
    <%= viewer.renderHTML() %>
</body>
</html>
[Windows Version (in Visual Basic)] vbdemo\scattersymbols.cls
Public Sub createChart(viewer As Object, chartIndex As Integer)

    Dim cd As New ChartDirector.API

    ' The XY points for the scatter chart
    Dim dataX()
    dataX = Array(200, 400, 300, 250, 500)
    Dim dataY()
    dataY = Array(40, 100, 50, 150, 250)

    ' The custom symbols for the points
    Dim symbols()
    symbols = Array("robot1.png", "robot2.png", "robot3.png", "robot4.png", "robot5.png")

    ' Create a XYChart object of size 450 x 400 pixels
    Dim c As XYChart
    Set c = cd.XYChart(450, 400)

    ' Set the plotarea at (55, 40) and of size 350 x 300 pixels, with a light grey border
    ' (0xc0c0c0). Turn on both horizontal and vertical grid lines with light grey color (0xc0c0c0)
    Call c.setPlotArea(55, 40, 350, 300, -1, -1, &Hc0c0c0, &Hc0c0c0, -1)

    ' Add a title to the chart using 18pt Times Bold Itatic font.
    Call c.addTitle("Battle Robots", "timesbi.ttf", 18)

    ' Add a title to the y axis using 12pt Arial Bold Italic font
    Call c.yAxis().setTitle("Speed (km/s)", "arialbi.ttf", 12)

    ' Add a title to the y axis using 12pt Arial Bold Italic font
    Call c.xAxis().setTitle("Range (km)", "arialbi.ttf", 12)

    ' Set the axes line width to 3 pixels
    Call c.xAxis().setWidth(3)
    Call c.yAxis().setWidth(3)

    ' Add each point of the data as a separate scatter layer, so that they can have a different
    ' symbol
    Dim i As Long
    For i = 0 To UBound(dataX)
        Call c.addScatterLayer(Array(dataX(i)), Array(dataY(i))).getDataSet(0).setDataSymbol2( _
            symbols(i))
    Next

    ' Output the chart
    Set viewer.Picture = c.makePicture()

    'include tool tip for the chart
    viewer.ImageMap = c.getHTMLImageMap("clickable", "", _
        "title='Range = {x} km, Speed = {value} km/s'")

End Sub
© 2021 Advanced Software Engineering Limited. All rights reserved.