[Web Version (in ASP)] aspdemo\scattertrend.asp
<%@ language="vbscript" %>
<%
Set cd = CreateObject("ChartDirector.API")
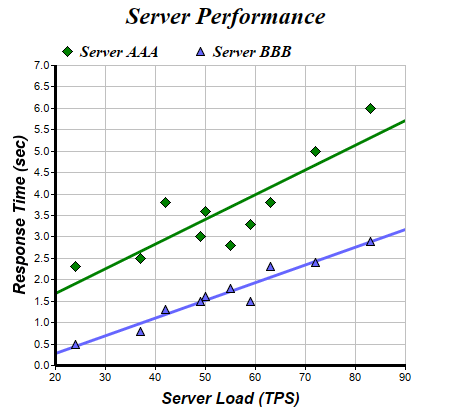
' The XY data of the first data series
dataX0 = Array(50, 55, 37, 24, 42, 49, 63, 72, 83, 59)
dataY0 = Array(3.6, 2.8, 2.5, 2.3, 3.8, 3.0, 3.8, 5.0, 6.0, 3.3)
' The XY data of the second data series
dataX1 = Array(50, 55, 37, 24, 42, 49, 63, 72, 83, 59)
dataY1 = Array(1.6, 1.8, 0.8, 0.5, 1.3, 1.5, 2.3, 2.4, 2.9, 1.5)
' Tool tip formats for data points and trend lines
scatterToolTip = "title='{dataSetName}: Response time at {x} TPS: {value} sec'"
trendToolTip = "title='Slope = {slope|4} sec/TPS; Intercept = {intercept|4} sec'"
' Create a XYChart object of size 450 x 420 pixels
Set c = cd.XYChart(450, 420)
' Set the plotarea at (55, 65) and of size 350 x 300 pixels, with white background and a light grey
' border (0xc0c0c0). Turn on both horizontal and vertical grid lines with light grey color
' (0xc0c0c0)
Call c.setPlotArea(55, 65, 350, 300, &Hffffff, -1, &Hc0c0c0, &Hc0c0c0, -1)
' Add a legend box at (50, 30) (top of the chart) with horizontal layout. Use 12pt Times Bold Italic
' font. Set the background and border color to Transparent.
Call c.addLegend(50, 30, False, "Times New Roman Bold Italic", 12).setBackground(cd.Transparent)
' Add a title to the chart using 18 point Times Bold Itatic font.
Call c.addTitle("Server Performance", "Times New Roman Bold Italic", 18)
' Add titles to the axes using 12pt Arial Bold Italic font
Call c.yAxis().setTitle("Response Time (sec)", "Arial Bold Italic", 12)
Call c.xAxis().setTitle("Server Load (TPS)", "Arial Bold Italic", 12)
' Set the axes line width to 3 pixels
Call c.yAxis().setWidth(3)
Call c.xAxis().setWidth(3)
' Add a scatter layer using (dataX0, dataY0)
Set scatter1 = c.addScatterLayer(dataX0, dataY0, "Server AAA", cd.DiamondSymbol, 11, &H008000)
Call scatter1.setHTMLImageMap("", "", scatterToolTip)
' Add a trend line layer for (dataX0, dataY0)
Set trend1 = c.addTrendLayer2(dataX0, dataY0, &H008000)
Call trend1.setLineWidth(3)
Call trend1.setHTMLImageMap("", "", trendToolTip)
' Add a scatter layer for (dataX1, dataY1)
Set scatter2 = c.addScatterLayer(dataX1, dataY1, "Server BBB", cd.TriangleSymbol, 9, &H6666ff)
Call scatter2.setHTMLImageMap("", "", scatterToolTip)
' Add a trend line layer for (dataX1, dataY1)
Set trend2 = c.addTrendLayer2(dataX1, dataY1, &H6666ff)
Call trend2.setLineWidth(3)
Call trend2.setHTMLImageMap("", "", trendToolTip)
' Output the chart
Set viewer = cd.WebChartViewer(Request, "chart1")
Call viewer.setChart(c, cd.SVG)
' include tool tip for the chart
viewer.ImageMap = c.getHTMLImageMap("")
%>
<!DOCTYPE html>
<html>
<head>
<title>Scatter Trend Chart</title>
<!-- Include ChartDirector Javascript Library to support chart interactions -->
<script type="text/javascript" src="cdjcv.js"></script>
</head>
<body style="margin:5px 0px 0px 5px">
<div style="font:bold 18pt verdana;">
Scatter Trend Chart
</div>
<hr style="border:solid 1px #000080; background:#000080" />
<div style="font:10pt verdana; margin-bottom:1.5em">
<a href="viewsource.asp?file=<%= Request("SCRIPT_NAME") %>">View Chart Source Code</a>
</div>
<!-- ****** Here is the chart image ****** -->
<%= viewer.renderHTML() %>
</body>
</html>
[Windows Version (in Visual Basic)] vbdemo\scattertrend.cls
Public Sub createChart(viewer As Object, chartIndex As Integer)

    Dim cd As New ChartDirector.API

    ' The XY data of the first data series
    Dim dataX0()
    dataX0 = Array(50, 55, 37, 24, 42, 49, 63, 72, 83, 59)
    Dim dataY0()
    dataY0 = Array(3.6, 2.8, 2.5, 2.3, 3.8, 3.0, 3.8, 5.0, 6.0, 3.3)

    ' The XY data of the second data series
    Dim dataX1()
    dataX1 = Array(50, 55, 37, 24, 42, 49, 63, 72, 83, 59)
    Dim dataY1()
    dataY1 = Array(1.6, 1.8, 0.8, 0.5, 1.3, 1.5, 2.3, 2.4, 2.9, 1.5)

    ' Tool tip formats for data points and trend lines
    Dim scatterToolTip As String
    scatterToolTip = "title='{dataSetName}: Response time at {x} TPS: {value} sec'"
    Dim trendToolTip As String
    trendToolTip = "title='Slope = {slope|4} sec/TPS; Intercept = {intercept|4} sec'"

    ' Create a XYChart object of size 450 x 420 pixels
    Dim c As XYChart
    Set c = cd.XYChart(450, 420)

    ' Set the plotarea at (55, 65) and of size 350 x 300 pixels, with white background and a light
    ' grey border (0xc0c0c0). Turn on both horizontal and vertical grid lines with light grey color
    ' (0xc0c0c0)
    Call c.setPlotArea(55, 65, 350, 300, &Hffffff, -1, &Hc0c0c0, &Hc0c0c0, -1)

    ' Add a legend box at (50, 30) (top of the chart) with horizontal layout. Use 12pt Times Bold
    ' Italic font. Set the background and border color to Transparent.
    Call c.addLegend(50, 30, False, "timesbi.ttf", 12).setBackground(cd.Transparent)

    ' Add a title to the chart using 18 point Times Bold Itatic font.
    Call c.addTitle("Server Performance", "timesbi.ttf", 18)

    ' Add titles to the axes using 12pt Arial Bold Italic font
    Call c.yAxis().setTitle("Response Time (sec)", "arialbi.ttf", 12)
    Call c.xAxis().setTitle("Server Load (TPS)", "arialbi.ttf", 12)

    ' Set the axes line width to 3 pixels
    Call c.yAxis().setWidth(3)
    Call c.xAxis().setWidth(3)

    ' Add a scatter layer using (dataX0, dataY0)
    Dim scatter1 As ScatterLayer
    Set scatter1 = c.addScatterLayer(dataX0, dataY0, "Server AAA", cd.DiamondSymbol, 11, &H008000)
    Call scatter1.setHTMLImageMap("", "", scatterToolTip)

    ' Add a trend line layer for (dataX0, dataY0)
    Dim trend1 As TrendLayer
    Set trend1 = c.addTrendLayer2(dataX0, dataY0, &H008000)
    Call trend1.setLineWidth(3)
    Call trend1.setHTMLImageMap("", "", trendToolTip)

    ' Add a scatter layer for (dataX1, dataY1)
    Dim scatter2 As ScatterLayer
    Set scatter2 = c.addScatterLayer(dataX1, dataY1, "Server BBB", cd.TriangleSymbol, 9, &H6666ff)
    Call scatter2.setHTMLImageMap("", "", scatterToolTip)

    ' Add a trend line layer for (dataX1, dataY1)
    Dim trend2 As TrendLayer
    Set trend2 = c.addTrendLayer2(dataX1, dataY1, &H6666ff)
    Call trend2.setLineWidth(3)
    Call trend2.setHTMLImageMap("", "", trendToolTip)

    ' Output the chart
    Set viewer.Picture = c.makePicture()

    ' include tool tip for the chart
    viewer.ImageMap = c.getHTMLImageMap("clickable")

End Sub
© 2021 Advanced Software Engineering Limited. All rights reserved.