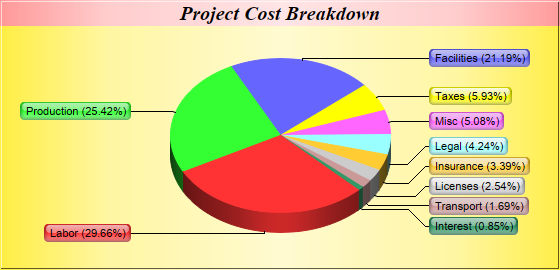
This example demonstrates the "side label layout" method for positioning the sector labels. It also demonstrates metallic background colors, and sector labels with glass shading effect and rounded corners.
With "side label layout", the sector labels are positioned on the left and right sides of the chart. In contrast, all previous examples use "circular label layout", in which the labels are positioned circularly around the pie.
"Side label layout" has the advantages that the labels will automatically shift up and down to avoid overlapping. In the above chart, there are a number of small sectors at the bottom-right of the pie. Note that the labels are shifted to avoid overlapping.
This example demonstrates a technique for further improving label layout by adjusting the start angle of the first sector using
PieChart.setStartAngle.
If the data have a lot of small values and are sorted, the small sectors will be crowded together. For these cases, label layout will be optimal (with the least shifting required) if the small sectors are at the left or right side of the pie, rather than at the top or bottom.
If the data are in descending order (like this example), a start angle of 135 degrees with clockwise sector layout can be used to put the small sectors at approximately 45 - 135 degrees (the right side of the pie). If the data are in ascending order, a start angle of 45 degrees with clockwise sector layout can be used to achieve similar effects.
[Web Version (in ASP)] aspdemo\sidelabelpie.asp
<%@ language="vbscript" %>
<%
Set cd = CreateObject("ChartDirector.API")

' The data for the pie chart
data = Array(35, 30, 25, 7, 6, 5, 4, 3, 2, 1)

' The labels for the pie chart
labels = Array("Labor", "Production", "Facilities", "Taxes", "Misc", "Legal", "Insurance", _
    "Licenses", "Transport", "Interest")

' Create a PieChart object of size 560 x 270 pixels, with a golden background and a 1 pixel 3D
' border
Set c = cd.PieChart(560, 270, cd.goldColor(), -1, 1)

' Add a title box using 15pt Times Bold Italic font and metallic pink background color
Call c.addTitle("Project Cost Breakdown", "Times New Roman Bold Italic", 15).setBackground( _
    cd.metalColor(&Hff9999))

' Set the center of the pie at (280, 135) and the radius to 110 pixels
Call c.setPieSize(280, 135, 110)

' Draw the pie in 3D with 20 pixels 3D depth
Call c.set3D(20)

' Use the side label layout method
Call c.setLabelLayout(cd.SideLayout)

' Set the label box background color the same as the sector color, with glass effect, and with 5
' pixels rounded corners
Set t = c.setLabelStyle()
Call t.setBackground(cd.SameAsMainColor, cd.Transparent, cd.glassEffect())
Call t.setRoundedCorners(5)

' Set the border color of the sector the same color as the fill color. Set the line color of the
' join line to black (0x0)
Call c.setLineColor(cd.SameAsMainColor, &H000000)

' Set the start angle to 135 degrees may improve layout when there are many small sectors at the end
' of the data array (that is, data sorted in descending order). It is because this makes the small
' sectors position near the horizontal axis, where the text label has the least tendency to overlap.
' For data sorted in ascending order, a start angle of 45 degrees can be used instead.
Call c.setStartAngle(135)

' Set the pie data and the pie labels
Call c.setData(data, labels)

' Output the chart
Set viewer = cd.WebChartViewer(Request, "chart1")
Call viewer.setChart(c, cd.SVG)

' Include tool tip for the chart
viewer.ImageMap = c.getHTMLImageMap("", "", "title='{label}: US${value}K ({percent}%)'")
%>

<!DOCTYPE html>
<html>
<head>
    <title>Side Label Layout</title>
    <!-- Include ChartDirector Javascript Library to support chart interactions -->
    <script type="text/javascript" src="cdjcv.js"></script>
</head>
<body style="margin:5px 0px 0px 5px">
    <div style="font:bold 18pt verdana;">
        Side Label Layout
    </div>
    <hr style="border:solid 1px #000080; background:#000080" />
    <div style="font:10pt verdana; margin-bottom:1.5em">
        <a href="viewsource.asp?file=<%= Request("SCRIPT_NAME") %>">View Chart Source Code</a>
    </div>
    <!-- ****** Here is the chart image ****** -->
    <%= viewer.renderHTML() %>
</body>
</html>
[Windows Version (in Visual Basic)] vbdemo\sidelabelpie.cls
Public Sub createChart(viewer As Object, chartIndex As Integer)

    Dim cd As New ChartDirector.API

    ' The data for the pie chart
    Dim data()
    data = Array(35, 30, 25, 7, 6, 5, 4, 3, 2, 1)

    ' The labels for the pie chart
    Dim labels()
    labels = Array("Labor", "Production", "Facilities", "Taxes", "Misc", "Legal", "Insurance", _
        "Licenses", "Transport", "Interest")

    ' Create a PieChart object of size 560 x 270 pixels, with a golden background and a 1 pixel 3D
    ' border
    Dim c As PieChart
    Set c = cd.PieChart(560, 270, cd.goldColor(), -1, 1)

    ' Add a title box using 15pt Times Bold Italic font and metallic pink background color
    Call c.addTitle("Project Cost Breakdown", "timesbi.ttf", 15).setBackground(cd.metalColor( _
        &Hff9999))

    ' Set the center of the pie at (280, 135) and the radius to 110 pixels
    Call c.setPieSize(280, 135, 110)

    ' Draw the pie in 3D with 20 pixels 3D depth
    Call c.set3D(20)

    ' Use the side label layout method
    Call c.setLabelLayout(cd.SideLayout)

    ' Set the label box background color the same as the sector color, with glass effect, and with 5
    ' pixels rounded corners
    Dim t As ChartDirector.TextBox
    Set t = c.setLabelStyle()
    Call t.setBackground(cd.SameAsMainColor, cd.Transparent, cd.glassEffect())
    Call t.setRoundedCorners(5)

    ' Set the border color of the sector the same color as the fill color. Set the line color of the
    ' join line to black (0x0)
    Call c.setLineColor(cd.SameAsMainColor, &H000000)

    ' Set the start angle to 135 degrees may improve layout when there are many small sectors at the
    ' end of the data array (that is, data sorted in descending order). It is because this makes the
    ' small sectors position near the horizontal axis, where the text label has the least tendency
    ' to overlap. For data sorted in ascending order, a start angle of 45 degrees can be used
    ' instead.
    Call c.setStartAngle(135)

    ' Set the pie data and the pie labels
    Call c.setData(data, labels)

    ' Output the chart
    Set viewer.Picture = c.makePicture()

    'include tool tip for the chart
    viewer.ImageMap = c.getHTMLImageMap("clickable", "", _
        "title='{label}: US${value}K ({percent}%)'")

End Sub
© 2021 Advanced Software Engineering Limited. All rights reserved.