[Web Version (in ASP)] aspdemo\stackedarea.asp
<%@ language="vbscript" %>
<%
Set cd = CreateObject("ChartDirector.API")
' The data for the area chart
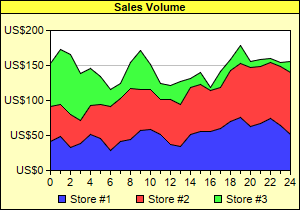
data0 = Array(42, 49, 33, 38, 51, 46, 29, 41, 44, 57, 59, 52, 37, 34, 51, 56, 56, 60, 70, 76, 63, _
67, 75, 64, 51)
data1 = Array(50, 45, 47, 34, 42, 49, 63, 62, 73, 59, 56, 50, 64, 60, 67, 67, 58, 59, 73, 77, 84, _
82, 80, 84, 89)
data2 = Array(61, 79, 85, 66, 53, 39, 24, 21, 37, 56, 37, 22, 21, 33, 13, 17, 4, 23, 16, 25, 9, _
10, 5, 7, 16)
labels = Array("0", "1", "2", "3", "4", "5", "6", "7", "8", "9", "10", "11", "12", "13", "14", _
"15", "16", "17", "18", "19", "20", "21", "22", "23", "24")
' Create a XYChart object of size 300 x 210 pixels. Set the background to pale yellow (0xffffc0)
' with a black border (0x0)
Set c = cd.XYChart(300, 210, &Hffffc0, &H000000)
' Set the plotarea at (50, 30) and of size 240 x 140 pixels. Use white (0xffffff) background.
Call c.setPlotArea(50, 30, 240, 140).setBackground(&Hffffff)
' Add a legend box at (50, 185) (below of plot area) using horizontal layout. Use 8pt Arial font
' with Transparent background.
Call c.addLegend(50, 185, False, "", 8).setBackground(cd.Transparent)
' Add a title box to the chart using 8pt Arial Bold font, with yellow (0xffff40) background and a
' black border (0x0)
Call c.addTitle("Sales Volume", "Arial Bold", 8).setBackground(&Hffff40, 0)
' Set the y axis label format to US$nnnn
Call c.yAxis().setLabelFormat("US${value}")
' Set the labels on the x axis.
Call c.xAxis().setLabels(labels)
' Display 1 out of 2 labels on the x-axis. Show minor ticks for remaining labels.
Call c.xAxis().setLabelStep(2, 1)
' Add an stack area layer with three data sets
Set layer = c.addAreaLayer2(cd.Stack)
Call layer.addDataSet(data0, &H4040ff, "Store #1")
Call layer.addDataSet(data1, &Hff4040, "Store #2")
Call layer.addDataSet(data2, &H40ff40, "Store #3")
' Output the chart
Set viewer = cd.WebChartViewer(Request, "chart1")
Call viewer.setChart(c, cd.SVG)
' Include tool tip for the chart
viewer.ImageMap = c.getHTMLImageMap("", "", _
"title='{dataSetName} sales at hour {xLabel}: US${value}K'")
%>
<!DOCTYPE html>
<html>
<head>
<title>Stacked Area Chart</title>
<!-- Include ChartDirector Javascript Library to support chart interactions -->
<script type="text/javascript" src="cdjcv.js"></script>
</head>
<body style="margin:5px 0px 0px 5px">
<div style="font:bold 18pt verdana;">
Stacked Area Chart
</div>
<hr style="border:solid 1px #000080; background:#000080" />
<div style="font:10pt verdana; margin-bottom:1.5em">
<a href="viewsource.asp?file=<%= Request("SCRIPT_NAME") %>">View Chart Source Code</a>
</div>
<!-- ****** Here is the chart image ****** -->
<%= viewer.renderHTML() %>
</body>
</html>
[Windows Version (in Visual Basic)] vbdemo\stackedarea.cls
Public Sub createChart(viewer As Object, chartIndex As Integer)

    Dim cd As New ChartDirector.API

    ' The data for the area chart
    Dim data0()
    data0 = Array(42, 49, 33, 38, 51, 46, 29, 41, 44, 57, 59, 52, 37, 34, 51, 56, 56, 60, 70, 76, _
        63, 67, 75, 64, 51)
    Dim data1()
    data1 = Array(50, 45, 47, 34, 42, 49, 63, 62, 73, 59, 56, 50, 64, 60, 67, 67, 58, 59, 73, 77, _
        84, 82, 80, 84, 89)
    Dim data2()
    data2 = Array(61, 79, 85, 66, 53, 39, 24, 21, 37, 56, 37, 22, 21, 33, 13, 17, 4, 23, 16, 25, _
        9, 10, 5, 7, 16)
    Dim labels()
    labels = Array("0", "1", "2", "3", "4", "5", "6", "7", "8", "9", "10", "11", "12", "13", "14", _
        "15", "16", "17", "18", "19", "20", "21", "22", "23", "24")

    ' Create a XYChart object of size 300 x 210 pixels. Set the background to pale yellow (0xffffc0)
    ' with a black border (0x0)
    Dim c As XYChart
    Set c = cd.XYChart(300, 210, &Hffffc0, &H000000)

    ' Set the plotarea at (50, 30) and of size 240 x 140 pixels. Use white (0xffffff) background.
    Call c.setPlotArea(50, 30, 240, 140).setBackground(&Hffffff)

    ' Add a legend box at (50, 185) (below of plot area) using horizontal layout. Use 8pt Arial font
    ' with Transparent background.
    Call c.addLegend(50, 185, False, "", 8).setBackground(cd.Transparent)

    ' Add a title box to the chart using 8pt Arial Bold font, with yellow (0xffff40) background and
    ' a black border (0x0)
    Call c.addTitle("Sales Volume", "arialbd.ttf", 8).setBackground(&Hffff40, 0)

    ' Set the y axis label format to US$nnnn
    Call c.yAxis().setLabelFormat("US${value}")

    ' Set the labels on the x axis.
    Call c.xAxis().setLabels(labels)

    ' Display 1 out of 2 labels on the x-axis. Show minor ticks for remaining labels.
    Call c.xAxis().setLabelStep(2, 1)

    ' Add an stack area layer with three data sets
    Dim layer As AreaLayer
    Set layer = c.addAreaLayer2(cd.Stack)
    Call layer.addDataSet(data0, &H4040ff, "Store #1")
    Call layer.addDataSet(data1, &Hff4040, "Store #2")
    Call layer.addDataSet(data2, &H40ff40, "Store #3")

    ' Output the chart
    Set viewer.Picture = c.makePicture()

    'include tool tip for the chart
    viewer.ImageMap = c.getHTMLImageMap("clickable", "", _
        "title='{dataSetName} sales at hour {xLabel}: US${value}K'")

End Sub
© 2021 Advanced Software Engineering Limited. All rights reserved.