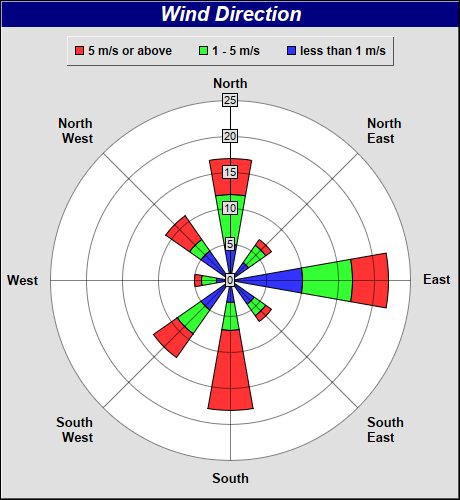
This example demonstrates how to create a stacked rose chart.
This example employs the same approach as the previous
Simple Rose Chart example. It creates a
PolarChart object as the graph paper, and adding sector zones on it using
AngularAxis.addZone. A transparent line layer is used for enabling auto-scaling.
In this example, multiple sectors are added for each angular direction, creating a "stacked" effect.
[Web Version (in ASP)] aspdemo\stackrose.asp
<%@ language="vbscript" %>
<%
Set cd = CreateObject("ChartDirector.API")

' Data for the chart
data0 = Array(5, 3, 10, 4, 3, 5, 2, 5)
data1 = Array(12, 6, 17, 6, 7, 9, 4, 7)
data2 = Array(17, 7, 22, 7, 18, 13, 5, 11)

angles = Array(0, 45, 90, 135, 180, 225, 270, 315)
labels = Array("North", "North<*br*>East", "East", "South<*br*>East", "South", "South<*br*>West", _
    "West", "North<*br*>West")

' Create a PolarChart object of size 460 x 500 pixels, with a grey (e0e0e0) background and a 1 pixel
' 3D border
Set c = cd.PolarChart(460, 500, &He0e0e0, &H000000, 1)

' Add a title to the chart at the top left corner using 15pt Arial Bold Italic font. Use white text
' on deep blue background.
Call c.addTitle("Wind Direction", "Arial Bold Italic", 15, &Hffffff).setBackground(&H000080)

Set legendBox = c.addLegend(230, 35, False, "Arial Bold", 9)
Call legendBox.setAlignment(cd.TopCenter)
Call legendBox.setBackground(cd.Transparent, cd.Transparent, 1)

Call legendBox.addKey("5 m/s or above", &Hff3333)
Call legendBox.addKey("1 - 5 m/s", &H33ff33)
Call legendBox.addKey("less than 1 m/s", &H3333ff)

' Set plot area center at (230, 280) with radius 180 pixels and white background
Call c.setPlotArea(230, 280, 180, &Hffffff)

' Set the grid style to circular grid
Call c.setGridStyle(False)

' Set angular axis as 0 - 360, with a spoke every 30 units
Call c.angularAxis().setLinearScale2(0, 360, labels)

For i = 0 To UBound(angles)
    Call c.angularAxis().addZone(angles(i) - 10, angles(i) + 10, 0, data0(i), &H3333ff, 0)
    Call c.angularAxis().addZone(angles(i) - 10, angles(i) + 10, data0(i), data1(i), &H33ff33, 0)
    Call c.angularAxis().addZone(angles(i) - 10, angles(i) + 10, data1(i), data2(i), &Hff3333, 0)
Next

' Add an Transparent invisible layer to ensure the axis is auto-scaled using the data
Call c.addLineLayer(data2, cd.Transparent)

' Output the chart
Set viewer = cd.WebChartViewer(Request, "chart1")
Call viewer.setChart(c, cd.SVG)
%>

<!DOCTYPE html>
<html>
<head>
    <title>Stacked Rose Chart</title>
    <!-- Include ChartDirector Javascript Library to support chart interactions -->
    <script type="text/javascript" src="cdjcv.js"></script>
</head>
<body style="margin:5px 0px 0px 5px">
    <div style="font:bold 18pt verdana;">
        Stacked Rose Chart
    </div>
    <hr style="border:solid 1px #000080; background:#000080" />
    <div style="font:10pt verdana; margin-bottom:1.5em">
        <a href="viewsource.asp?file=<%= Request("SCRIPT_NAME") %>">View Chart Source Code</a>
    </div>
    <!-- ****** Here is the chart image ****** -->
    <%= viewer.renderHTML() %>
</body>
</html>
[Windows Version (in Visual Basic)] vbdemo\stackrose.cls
Public Sub createChart(viewer As Object, chartIndex As Integer)

    Dim cd As New ChartDirector.API

    ' Data for the chart
    Dim data0()
    data0 = Array(5, 3, 10, 4, 3, 5, 2, 5)
    Dim data1()
    data1 = Array(12, 6, 17, 6, 7, 9, 4, 7)
    Dim data2()
    data2 = Array(17, 7, 22, 7, 18, 13, 5, 11)

    Dim angles()
    angles = Array(0, 45, 90, 135, 180, 225, 270, 315)
    Dim labels()
    labels = Array("North", "North<*br*>East", "East", "South<*br*>East", "South", _
        "South<*br*>West", "West", "North<*br*>West")

    ' Create a PolarChart object of size 460 x 500 pixels, with a grey (e0e0e0) background and a 1
    ' pixel 3D border
    Dim c As PolarChart
    Set c = cd.PolarChart(460, 500, &He0e0e0, &H000000, 1)

    ' Add a title to the chart at the top left corner using 15pt Arial Bold Italic font. Use white
    ' text on deep blue background.
    Call c.addTitle("Wind Direction", "arialbi.ttf", 15, &Hffffff).setBackground(&H000080)

    Dim legendBox As LegendBox
    Set legendBox = c.addLegend(230, 35, False, "arialbd.ttf", 9)
    Call legendBox.setAlignment(cd.TopCenter)
    Call legendBox.setBackground(cd.Transparent, cd.Transparent, 1)

    Call legendBox.addKey("5 m/s or above", &Hff3333)
    Call legendBox.addKey("1 - 5 m/s", &H33ff33)
    Call legendBox.addKey("less than 1 m/s", &H3333ff)

    ' Set plot area center at (230, 280) with radius 180 pixels and white background
    Call c.setPlotArea(230, 280, 180, &Hffffff)

    ' Set the grid style to circular grid
    Call c.setGridStyle(False)

    ' Set angular axis as 0 - 360, with a spoke every 30 units
    Call c.angularAxis().setLinearScale2(0, 360, labels)

    Dim i As Long
    For i = 0 To UBound(angles)
        Call c.angularAxis().addZone(angles(i) - 10, angles(i) + 10, 0, data0(i), &H3333ff, 0)
        Call c.angularAxis().addZone(angles(i) - 10, angles(i) + 10, data0(i), data1(i), &H33ff33,0)
        Call c.angularAxis().addZone(angles(i) - 10, angles(i) + 10, data1(i), data2(i), &Hff3333,0)
    Next

    ' Add an Transparent invisible layer to ensure the axis is auto-scaled using the data
    Call c.addLineLayer(data2, cd.Transparent)

    ' Output the chart
    Set viewer.Picture = c.makePicture()

End Sub
© 2021 Advanced Software Engineering Limited. All rights reserved.