[Web Version (in ASP)] aspdemo\surface2.asp
<%@ language="vbscript" %>
<%
Set cd = CreateObject("ChartDirector.API")
' The x and y coordinates of the grid
dataX = Array(0, 0.1, 0.2, 0.3, 0.4, 0.5, 0.6, 0.7, 0.8, 0.9, 1.0)
dataY = Array(0, 0.1, 0.2, 0.3, 0.4, 0.5, 0.6, 0.7, 0.8, 0.9, 1.0)
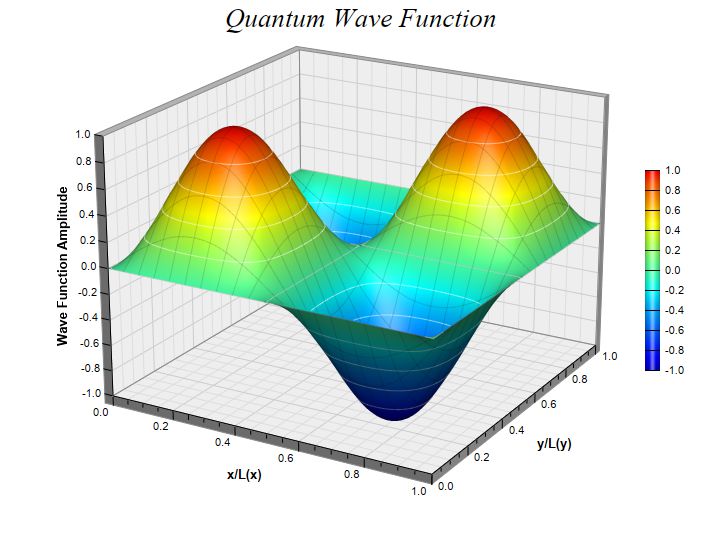
' The values at the grid points. In this example, we will compute the values using the formula z =
' sin((x - 0.5) * 2 * pi) * sin((y - 0.5) * 2 * pi)
ReDim dataZ((UBound(dataX) + 1) * (UBound(dataY) + 1) - 1)
For yIndex = 0 To UBound(dataY)
y = (dataY(yIndex) - 0.5) * 2 * 3.1416
For xIndex = 0 To UBound(dataX)
x = (dataX(xIndex) - 0.5) * 2 * 3.1416
dataZ(yIndex * (UBound(dataX) + 1) + xIndex) = Sin(x) * Sin(y)
Next
Next
' Create a SurfaceChart object of size 720 x 540 pixels
Set c = cd.SurfaceChart(720, 540)
' Add a title to the chart using 20 points Times New Roman Italic font
Call c.addTitle("Quantum Wave Function", "Times New Roman Italic", 20)
' Set the center of the plot region at (360, 245), and set width x depth x height to 360 x 360 x 270
' pixels
Call c.setPlotRegion(360, 245, 360, 360, 270)
' Set the elevation and rotation angles to 20 and 30 degrees
Call c.setViewAngle(20, 30)
' Set the data to use to plot the chart
Call c.setData(dataX, dataY, dataZ)
' Spline interpolate data to a 80 x 80 grid for a smooth surface
Call c.setInterpolation(80, 80)
' Set surface grid lines to semi-transparent black (dd000000)
Call c.setSurfaceAxisGrid(&Hdd000000)
' Set contour lines to semi-transparent white (80ffffff)
Call c.setContourColor(&H80ffffff)
' Add a color axis (the legend) in which the left center is anchored at (645, 270). Set the length
' to 200 pixels and the labels on the right side. Use smooth gradient coloring.
Call c.setColorAxis(645, 270, cd.Left, 200, cd.Right).setColorGradient()
' Set the x, y and z axis titles using 10 points Arial Bold font
Call c.xAxis().setTitle("x/L(x)", "Arial Bold", 10)
Call c.yAxis().setTitle("y/L(y)", "Arial Bold", 10)
Call c.zAxis().setTitle("Wave Function Amplitude", "Arial Bold", 10)
' Output the chart
Set viewer = cd.WebChartViewer(Request, "chart1")
Call viewer.setChart(c, cd.SVG)
%>
<!DOCTYPE html>
<html>
<head>
<title>Surface Chart (2)</title>
<!-- Include ChartDirector Javascript Library to support chart interactions -->
<script type="text/javascript" src="cdjcv.js"></script>
</head>
<body style="margin:5px 0px 0px 5px">
<div style="font:bold 18pt verdana;">
Surface Chart (2)
</div>
<hr style="border:solid 1px #000080; background:#000080" />
<div style="font:10pt verdana; margin-bottom:1.5em">
<a href="viewsource.asp?file=<%= Request("SCRIPT_NAME") %>">View Chart Source Code</a>
</div>
<!-- ****** Here is the chart image ****** -->
<%= viewer.renderHTML() %>
</body>
</html>
[Windows Version (in Visual Basic)] vbdemo\surface2.cls
Public Sub createChart(viewer As Object, chartIndex As Integer)

    Dim cd As New ChartDirector.API

    ' The x and y coordinates of the grid
    Dim dataX()
    dataX = Array(0, 0.1, 0.2, 0.3, 0.4, 0.5, 0.6, 0.7, 0.8, 0.9, 1.0)
    Dim dataY()
    dataY = Array(0, 0.1, 0.2, 0.3, 0.4, 0.5, 0.6, 0.7, 0.8, 0.9, 1.0)

    ' The values at the grid points. In this example, we will compute the values using the formula z
    ' = sin((x - 0.5) * 2 * pi) * sin((y - 0.5) * 2 * pi)
    ReDim dataZ((UBound(dataX) + 1) * (UBound(dataY) + 1) - 1)
    Dim yIndex As Long
    For yIndex = 0 To UBound(dataY)
        Dim y As Double
        y = (dataY(yIndex) - 0.5) * 2 * 3.1416
        Dim xIndex As Long
        For xIndex = 0 To UBound(dataX)
            Dim x As Double
            x = (dataX(xIndex) - 0.5) * 2 * 3.1416
            dataZ(yIndex * (UBound(dataX) + 1) + xIndex) = Sin(x) * Sin(y)
        Next
    Next

    ' Create a SurfaceChart object of size 720 x 540 pixels
    Dim c As SurfaceChart
    Set c = cd.SurfaceChart(720, 540)

    ' Add a title to the chart using 20 points Times New Roman Italic font
    Call c.addTitle("Quantum Wave Function", "timesi.ttf", 20)

    ' Set the center of the plot region at (360, 245), and set width x depth x height to 360 x 360 x
    ' 270 pixels
    Call c.setPlotRegion(360, 245, 360, 360, 270)

    ' Set the elevation and rotation angles to 20 and 30 degrees
    Call c.setViewAngle(20, 30)

    ' Set the data to use to plot the chart
    Call c.setData(dataX, dataY, dataZ)

    ' Spline interpolate data to a 80 x 80 grid for a smooth surface
    Call c.setInterpolation(80, 80)

    ' Set surface grid lines to semi-transparent black (dd000000)
    Call c.setSurfaceAxisGrid(&Hdd000000)

    ' Set contour lines to semi-transparent white (80ffffff)
    Call c.setContourColor(&H80ffffff)

    ' Add a color axis (the legend) in which the left center is anchored at (645, 270). Set the
    ' length to 200 pixels and the labels on the right side. Use smooth gradient coloring.
    Call c.setColorAxis(645, 270, cd.Left, 200, cd.Right).setColorGradient()

    ' Set the x, y and z axis titles using 10 points Arial Bold font
    Call c.xAxis().setTitle("x/L(x)", "arialbd.ttf", 10)
    Call c.yAxis().setTitle("y/L(y)", "arialbd.ttf", 10)
    Call c.zAxis().setTitle("Wave Function Amplitude", "arialbd.ttf", 10)

    ' Output the chart
    Set viewer.Picture = c.makePicture()

End Sub
© 2021 Advanced Software Engineering Limited. All rights reserved.