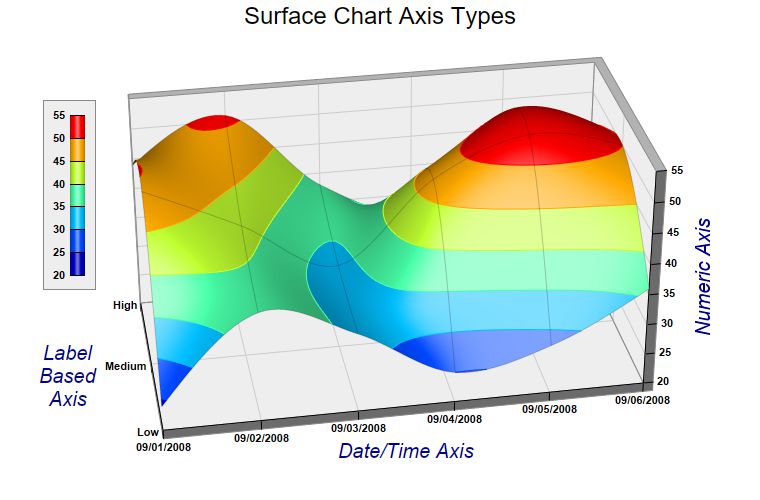
The example demonstrates different axis scale types for the surface charts.
Like an
XYChart, in a
SurfaceChart, the axis scale can represent numbers, date/time or labels. In this example, the x-axis uses a date/time scale, the y-axis uses a label based scale, and the z-axis uses a numeric scale.
[Web Version (in ASP)] aspdemo\surfaceaxis.asp
<%@ language="vbscript" %>
<%
Set cd = CreateObject("ChartDirector.API")

' The x and y coordinates of the grid
dataX = Array(DateSerial(2008, 9, 1), DateSerial(2008, 9, 2), DateSerial(2008, 9, 3), DateSerial( _
    2008, 9, 4), DateSerial(2008, 9, 5), DateSerial(2008, 9, 6))
dataY = Array("Low", "Medium", "High")

' The data series
lowData = Array(24, 38, 33, 25, 28, 36)
mediumData = Array(49, 42, 34, 47, 53, 50)
highData = Array(44, 51, 38, 33, 47, 42)

' Create a SurfaceChart object of size 760 x 500 pixels
Set c = cd.SurfaceChart(760, 500)

' Add a title to the chart using 18 points Arial font
Call c.addTitle("Surface Chart Axis Types", "Arial", 18)

' Set the center of the plot region at (385, 240), and set width x depth x height to 480 x 240 x 240
' pixels
Call c.setPlotRegion(385, 240, 480, 240, 240)

' Set the elevation and rotation angles to 30 and -10 degrees
Call c.setViewAngle(30, -10)

' Set the data to use to plot the chart. As the y-data are text strings (enumerated), we will use an
' empty array for the y-coordinates. For the z data series, they are just the concatenation of the
' individual data series.
Call c.setData(dataX, Empty, cd.ArrayMath(lowData).insert(mediumData).insert(highData).result())

' Set the y-axis labels
Call c.yAxis().setLabels(dataY)

' Set x-axis tick density to 75 pixels. ChartDirector auto-scaling will use this as the guideline
' when putting ticks on the x-axis.
Call c.xAxis().setTickDensity(75)

' Spline interpolate data to a 80 x 40 grid for a smooth surface
Call c.setInterpolation(80, 40)

' Set surface grid lines to semi-transparent black (cc000000).
Call c.setSurfaceAxisGrid(&Hcc000000)

' Set contour lines to the same color as the fill color at the contour level
Call c.setContourColor(cd.SameAsMainColor)

' Add a color axis (the legend) in which the top right corner is anchored at (95, 100). Set the
' length to 160 pixels and the labels on the left side.
Set cAxis = c.setColorAxis(95, 100, cd.TopRight, 160, cd.Left)

' Add a bounding box with light grey (eeeeee) background and grey (888888) border.
Call cAxis.setBoundingBox(&Heeeeee, &H888888)

' Set label style to Arial bold for all axes
Call c.xAxis().setLabelStyle("Arial Bold")
Call c.yAxis().setLabelStyle("Arial Bold")
Call c.zAxis().setLabelStyle("Arial Bold")
Call c.colorAxis().setLabelStyle("Arial Bold")

' Set the x, y and z axis titles using deep blue (000088) 15 points Arial font
Call c.xAxis().setTitle("Date/Time Axis", "Arial Italic", 15, &H000088)
Call c.yAxis().setTitle("Label<*br*>Based<*br*>Axis", "Arial Italic", 15, &H000088)
Call c.zAxis().setTitle("Numeric Axis", "Arial Italic", 15, &H000088)

' Output the chart
Set viewer = cd.WebChartViewer(Request, "chart1")
Call viewer.setChart(c, cd.SVG)
%>

<!DOCTYPE html>
<html>
<head>
    <title>Surface Chart Axis Types</title>
    <!-- Include ChartDirector Javascript Library to support chart interactions -->
    <script type="text/javascript" src="cdjcv.js"></script>
</head>
<body style="margin:5px 0px 0px 5px">
    <div style="font:bold 18pt verdana;">
        Surface Chart Axis Types
    </div>
    <hr style="border:solid 1px #000080; background:#000080" />
    <div style="font:10pt verdana; margin-bottom:1.5em">
        <a href="viewsource.asp?file=<%= Request("SCRIPT_NAME") %>">View Chart Source Code</a>
    </div>
    <!-- ****** Here is the chart image ****** -->
    <%= viewer.renderHTML() %>
</body>
</html>
[Windows Version (in Visual Basic)] vbdemo\surfaceaxis.cls
Public Sub createChart(viewer As Object, chartIndex As Integer)

    Dim cd As New ChartDirector.API

    ' The x and y coordinates of the grid
    Dim dataX()
    dataX = Array(DateSerial(2008, 9, 1), DateSerial(2008, 9, 2), DateSerial(2008, 9, 3), _
        DateSerial(2008, 9, 4), DateSerial(2008, 9, 5), DateSerial(2008, 9, 6))
    Dim dataY()
    dataY = Array("Low", "Medium", "High")

    ' The data series
    Dim lowData()
    lowData = Array(24, 38, 33, 25, 28, 36)
    Dim mediumData()
    mediumData = Array(49, 42, 34, 47, 53, 50)
    Dim highData()
    highData = Array(44, 51, 38, 33, 47, 42)

    ' Create a SurfaceChart object of size 760 x 500 pixels
    Dim c As SurfaceChart
    Set c = cd.SurfaceChart(760, 500)

    ' Add a title to the chart using 18 points Arial font
    Call c.addTitle("Surface Chart Axis Types", "arial.ttf", 18)

    ' Set the center of the plot region at (385, 240), and set width x depth x height to 480 x 240 x
    ' 240 pixels
    Call c.setPlotRegion(385, 240, 480, 240, 240)

    ' Set the elevation and rotation angles to 30 and -10 degrees
    Call c.setViewAngle(30, -10)

    ' Set the data to use to plot the chart. As the y-data are text strings (enumerated), we will
    ' use an empty array for the y-coordinates. For the z data series, they are just the
    ' concatenation of the individual data series.
    Call c.setData(dataX, Empty, cd.ArrayMath(lowData).insert(mediumData).insert(highData).result())

    ' Set the y-axis labels
    Call c.yAxis().setLabels(dataY)

    ' Set x-axis tick density to 75 pixels. ChartDirector auto-scaling will use this as the
    ' guideline when putting ticks on the x-axis.
    Call c.xAxis().setTickDensity(75)

    ' Spline interpolate data to a 80 x 40 grid for a smooth surface
    Call c.setInterpolation(80, 40)

    ' Set surface grid lines to semi-transparent black (cc000000).
    Call c.setSurfaceAxisGrid(&Hcc000000)

    ' Set contour lines to the same color as the fill color at the contour level
    Call c.setContourColor(cd.SameAsMainColor)

    ' Add a color axis (the legend) in which the top right corner is anchored at (95, 100). Set the
    ' length to 160 pixels and the labels on the left side.
    Dim cAxis As ColorAxis
    Set cAxis = c.setColorAxis(95, 100, cd.TopRight, 160, cd.Left)

    ' Add a bounding box with light grey (eeeeee) background and grey (888888) border.
    Call cAxis.setBoundingBox(&Heeeeee, &H888888)

    ' Set label style to Arial bold for all axes
    Call c.xAxis().setLabelStyle("arialbd.ttf")
    Call c.yAxis().setLabelStyle("arialbd.ttf")
    Call c.zAxis().setLabelStyle("arialbd.ttf")
    Call c.colorAxis().setLabelStyle("arialbd.ttf")

    ' Set the x, y and z axis titles using deep blue (000088) 15 points Arial font
    Call c.xAxis().setTitle("Date/Time Axis", "ariali.ttf", 15, &H000088)
    Call c.yAxis().setTitle("Label<*br*>Based<*br*>Axis", "ariali.ttf", 15, &H000088)
    Call c.zAxis().setTitle("Numeric Axis", "ariali.ttf", 15, &H000088)

    ' Output the chart
    Set viewer.Picture = c.makePicture()

End Sub
© 2021 Advanced Software Engineering Limited. All rights reserved.