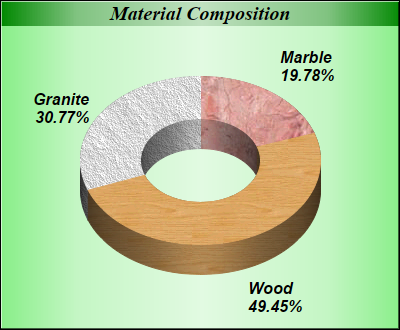
This example demonstrates wooden, rocky and marble texture effects by using pattern colors to load image patterns.
In ChartDirector, metallic and pattern colors are just like normal ARGB colors, and are represented as a 32-bit integer. They can be applied to anything that can be colored. In this example, metallic colors are applied to the background, while pattern colors are applied to the donut slices to create texture effects.
- BaseChart.patternColor2 is used to load the texture images. It returns an array of integers representing the pattern colors created from the images.
- The pattern colors are then set into the DataColor positions of the default palette using BaseChart.setColor. These colors will be used for the sectors.
[Web Version (in ASP)] aspdemo\texturedonut.asp
<%@ language="vbscript" %>
<%
Set cd = CreateObject("ChartDirector.API")

' The data for the pie chart
data = Array(18, 45, 28)

' The labels for the pie chart
labels = Array("Marble", "Wood", "Granite")

' The icons for the sectors
texture = Array("marble3.png", "wood.png", "rock.png")

' Create a PieChart object of size 400 x 330 pixels, with a metallic green (88EE88) background,
' black border and 1 pixel 3D border effect
Set c = cd.PieChart(400, 330, cd.metalColor(&H88ee88), &H000000, 1)

' Set default directory for loading images from current script directory
Call c.setSearchPath(Server.MapPath("."))

' Set donut center at (200, 160), and outer/inner radii as 120/60 pixels
Call c.setDonutSize(200, 160, 120, 60)

' Add a title box using 15pt Times Bold Italic font and metallic deep green (008000) background
' color
Call c.addTitle("Material Composition", "Times New Roman Bold Italic", 15).setBackground( _
    cd.metalColor(&H008000))

' Set the pie data and the pie labels
Call c.setData(data, labels)

' Set the colors of the sectors to the 3 texture patterns
Call c.setColor(cd.DataColor + 0, c.patternColor2(texture(0)))
Call c.setColor(cd.DataColor + 1, c.patternColor2(texture(1)))
Call c.setColor(cd.DataColor + 2, c.patternColor2(texture(2)))

' Draw the pie in 3D with a 3D depth of 30 pixels
Call c.set3D(30)

' Use 12pt Arial Bold Italic as the sector label font
Call c.setLabelStyle("Arial Bold Italic", 12)

' Output the chart
Set viewer = cd.WebChartViewer(Request, "chart1")
Call viewer.setChart(c, cd.SVG)

' Include tool tip for the chart
viewer.ImageMap = c.getHTMLImageMap("", "", "title='{label}: {value}kg ({percent}%)'")
%>

<!DOCTYPE html>
<html>
<head>
    <title>Texture Donut Chart</title>
    <!-- Include ChartDirector Javascript Library to support chart interactions -->
    <script type="text/javascript" src="cdjcv.js"></script>
</head>
<body style="margin:5px 0px 0px 5px">
    <div style="font:bold 18pt verdana;">
        Texture Donut Chart
    </div>
    <hr style="border:solid 1px #000080; background:#000080" />
    <div style="font:10pt verdana; margin-bottom:1.5em">
        <a href="viewsource.asp?file=<%= Request("SCRIPT_NAME") %>">View Chart Source Code</a>
    </div>
    <!-- ****** Here is the chart image ****** -->
    <%= viewer.renderHTML() %>
</body>
</html>
[Windows Version (in Visual Basic)] vbdemo\texturedonut.cls
Public Sub createChart(viewer As Object, chartIndex As Integer)

    Dim cd As New ChartDirector.API

    ' The data for the pie chart
    Dim data()
    data = Array(18, 45, 28)

    ' The labels for the pie chart
    Dim labels()
    labels = Array("Marble", "Wood", "Granite")

    ' The icons for the sectors
    Dim texture()
    texture = Array("marble3.png", "wood.png", "rock.png")

    ' Create a PieChart object of size 400 x 330 pixels, with a metallic green (88EE88) background,
    ' black border and 1 pixel 3D border effect
    Dim c As PieChart
    Set c = cd.PieChart(400, 330, cd.metalColor(&H88ee88), &H000000, 1)

    ' Set donut center at (200, 160), and outer/inner radii as 120/60 pixels
    Call c.setDonutSize(200, 160, 120, 60)

    ' Add a title box using 15pt Times Bold Italic font and metallic deep green (008000) background
    ' color
    Call c.addTitle("Material Composition", "timesbi.ttf", 15).setBackground(cd.metalColor( _
        &H008000))

    ' Set the pie data and the pie labels
    Call c.setData(data, labels)

    ' Set the colors of the sectors to the 3 texture patterns
    Call c.setColor(cd.DataColor + 0, c.patternColor2(texture(0)))
    Call c.setColor(cd.DataColor + 1, c.patternColor2(texture(1)))
    Call c.setColor(cd.DataColor + 2, c.patternColor2(texture(2)))

    ' Draw the pie in 3D with a 3D depth of 30 pixels
    Call c.set3D(30)

    ' Use 12pt Arial Bold Italic as the sector label font
    Call c.setLabelStyle("arialbi.ttf", 12)

    ' Output the chart
    Set viewer.Picture = c.makePicture()

    'include tool tip for the chart
    viewer.ImageMap = c.getHTMLImageMap("clickable", "", "title='{label}: {value}kg ({percent}%)'")

End Sub
© 2021 Advanced Software Engineering Limited. All rights reserved.