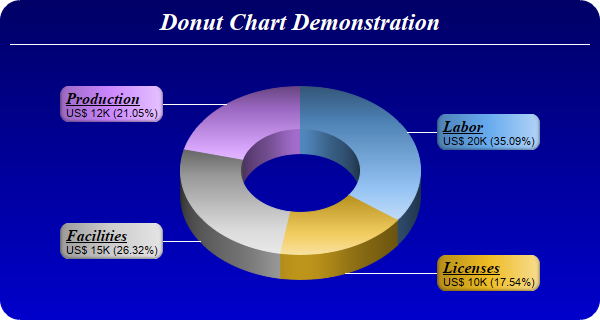
This example demonstrates a 3D donut chart with sector gradient shading. It also demonstrates gradient color background, rounded frame, custom sector colors, and using
CDML and
Parameter Substitution and Formatting to format sector labels
[Web Version (in ASP)] aspdemo\threeddonut.asp
<%@ language="vbscript" %>
<%
Set cd = CreateObject("ChartDirector.API")

' The data for the pie chart
data = Array(20, 10, 15, 12)

' The labels for the pie chart
labels = Array("Labor", "Licenses", "Facilities", "Production")

' The colors to use for the sectors
colors = Array(&H66aaee, &Heebb22, &Hcccccc, &Hcc88ff)

' Create a PieChart object of size 600 x 320 pixels. Use a vertical gradient color from deep blue
' (000066) to blue (0000cc) as background. Use rounded corners of 20 pixels radius.
Set c = cd.PieChart(600, 320)
Call c.setBackground(c.linearGradientColor(0, 0, 0, c.getHeight(), &H000066, &H0000cc))
Call c.setRoundedFrame(&Hffffff, 20)

' Add a title using 18pt Times New Roman Bold Italic font in white (ffffff) color. Set top/bottom
' margins to 8 pixels.
Set title = c.addTitle("Donut Chart Demonstration", "Times New Roman Bold Italic", 18, &Hffffff)
Call title.setMargin2(0, 0, 8, 8)

' Add a separator line in white color just under the title
Call c.addLine(10, title.getHeight(), c.getWidth() - 11, title.getHeight(), &Hffffff)

' Set donut center at (300, 170), and outer/inner radii as 120/60 pixels
Call c.setDonutSize(300, 170, 120, 60)

' Draw the pie in 3D with a pie thickness of 25 pixels
Call c.set3D(25)

' Set the pie data and the pie labels
Call c.setData(data, labels)

' Set the sector colors
Call c.setColors2(cd.DataColor, colors)

' Use local gradient shading for the sectors
Call c.setSectorStyle(cd.LocalGradientShading)

' Set sector border color to same as fill color. Set label join line color to white (ffffff)
Call c.setLineColor(cd.SameAsMainColor, &Hffffff)

' Use the side label layout method, with the labels positioned 16 pixels from the donut bounding box
Call c.setLabelLayout(cd.SideLayout, 16)

' Set the sector label format. The label consists of two lines. The first line is the sector name in
' Times Bold Italic font and is underlined. The second line shows the data value and percentage.
Call c.setLabelFormat( _
    "<*block,halign=left*><*font=Times New Roman Bold Italic,size=12,underline=1*>{label}" & _
    "<*/font*><*br*>US$ {value}K ({percent}%)")

' Set the label box background color the same as the sector color. Use soft lighting effect with
' light direction from right. Use rounded corners.
Set t = c.setLabelStyle()
Call t.setBackground(cd.SameAsMainColor, cd.Transparent, cd.softLighting(cd.Right))
Call t.setRoundedCorners()

' Output the chart
Set viewer = cd.WebChartViewer(Request, "chart1")
Call viewer.setChart(c, cd.SVG)

' Include tool tip for the chart
viewer.ImageMap = c.getHTMLImageMap("", "", "title='{label}: US${value}K ({percent}%)'")
%>

<!DOCTYPE html>
<html>
<head>
    <title>3D Donut Chart</title>
    <!-- Include ChartDirector Javascript Library to support chart interactions -->
    <script type="text/javascript" src="cdjcv.js"></script>
</head>
<body style="margin:5px 0px 0px 5px">
    <div style="font:bold 18pt verdana;">
        3D Donut Chart
    </div>
    <hr style="border:solid 1px #000080; background:#000080" />
    <div style="font:10pt verdana; margin-bottom:1.5em">
        <a href="viewsource.asp?file=<%= Request("SCRIPT_NAME") %>">View Chart Source Code</a>
    </div>
    <!-- ****** Here is the chart image ****** -->
    <%= viewer.renderHTML() %>
</body>
</html>
[Windows Version (in Visual Basic)] vbdemo\threeddonut.cls
Public Sub createChart(viewer As Object, chartIndex As Integer)

    Dim cd As New ChartDirector.API

    ' The data for the pie chart
    Dim data()
    data = Array(20, 10, 15, 12)

    ' The labels for the pie chart
    Dim labels()
    labels = Array("Labor", "Licenses", "Facilities", "Production")

    ' The colors to use for the sectors
    Dim colors()
    colors = Array(&H66aaee, &Heebb22, &Hcccccc, &Hcc88ff)

    ' Create a PieChart object of size 600 x 320 pixels. Use a vertical gradient color from deep
    ' blue (000066) to blue (0000cc) as background. Use rounded corners of 20 pixels radius.
    Dim c As PieChart
    Set c = cd.PieChart(600, 320)
    Call c.setBackground(c.linearGradientColor(0, 0, 0, c.getHeight(), &H000066, &H0000cc))
    Call c.setRoundedFrame(&Hffffff, 20)

    ' Add a title using 18pt Times New Roman Bold Italic font in white (ffffff) color. Set
    ' top/bottom margins to 8 pixels.
    Dim title As ChartDirector.TextBox
    Set title = c.addTitle("Donut Chart Demonstration", "timesbi.ttf", 18, &Hffffff)
    Call title.setMargin2(0, 0, 8, 8)

    ' Add a separator line in white color just under the title
    Call c.addLine(10, title.getHeight(), c.getWidth() - 11, title.getHeight(), &Hffffff)

    ' Set donut center at (300, 170), and outer/inner radii as 120/60 pixels
    Call c.setDonutSize(300, 170, 120, 60)

    ' Draw the pie in 3D with a pie thickness of 25 pixels
    Call c.set3D(25)

    ' Set the pie data and the pie labels
    Call c.setData(data, labels)

    ' Set the sector colors
    Call c.setColors2(cd.DataColor, colors)

    ' Use local gradient shading for the sectors
    Call c.setSectorStyle(cd.LocalGradientShading)

    ' Set sector border color to same as fill color. Set label join line color to white (ffffff)
    Call c.setLineColor(cd.SameAsMainColor, &Hffffff)

    ' Use the side label layout method, with the labels positioned 16 pixels from the donut bounding
    ' box
    Call c.setLabelLayout(cd.SideLayout, 16)

    ' Set the sector label format. The label consists of two lines. The first line is the sector
    ' name in Times Bold Italic font and is underlined. The second line shows the data value and
    ' percentage.
    Call c.setLabelFormat( _
        "<*block,halign=left*><*font=timesbi.ttf,size=12,underline=1*>{label}<*/font*><*br*>" & _
        "US$ {value}K ({percent}%)")

    ' Set the label box background color the same as the sector color. Use soft lighting effect with
    ' light direction from right. Use rounded corners.
    Dim t As ChartDirector.TextBox
    Set t = c.setLabelStyle()
    Call t.setBackground(cd.SameAsMainColor, cd.Transparent, cd.softLighting(cd.Right))
    Call t.setRoundedCorners()

    ' Output the chart
    Set viewer.Picture = c.makePicture()

    'include tool tip for the chart
    viewer.ImageMap = c.getHTMLImageMap("clickable", "", _
        "title='{label}: US${value}K ({percent}%)'")

End Sub
© 2021 Advanced Software Engineering Limited. All rights reserved.