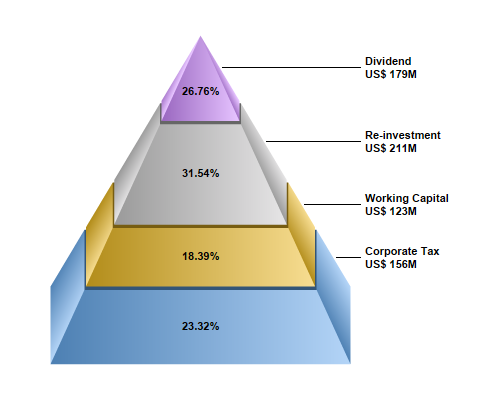
This example extends the
Simple Pyramid Chart example by viewing the pyramid in 3D, using custom colors, inserting gaps between pyramid layers, and adding labels to both the center and the right side of the pyramid layers.
[Web Version (in ASP)] aspdemo\threedpyramid.asp
<%@ language="vbscript" %>
<%
Set cd = CreateObject("ChartDirector.API")

' The data for the pyramid chart
data = Array(156, 123, 211, 179)

' The labels for the pyramid chart
labels = Array("Corporate Tax", "Working Capital", "Re-investment", "Dividend")

' The colors for the pyramid layers
colors = Array(&H66aaee, &Heebb22, &Hcccccc, &Hcc88ff)

' Create a PyramidChart object of size 500 x 400 pixels
Set c = cd.PyramidChart(500, 400)

' Set the pyramid center at (200, 180), and width x height to 150 x 300 pixels
Call c.setPyramidSize(200, 180, 150, 300)

' Set the elevation to 15 degrees
Call c.setViewAngle(15)

' Set the pyramid data and labels
Call c.setData(data, labels)

' Set the layer colors to the given colors
Call c.setColors2(cd.DataColor, colors)

' Leave 1% gaps between layers
Call c.setLayerGap(0.01)

' Add labels at the center of the pyramid layers using Arial Bold font. The labels will show the
' percentage of the layers.
Call c.setCenterLabel("{percent}%", "Arial Bold")

' Add labels at the right side of the pyramid layers using Arial Bold font. The labels will have two
' lines showing the layer name and value.
Call c.setRightLabel("{label}<*br*>US$ {value}M", "Arial Bold")

' Output the chart
Set viewer = cd.WebChartViewer(Request, "chart1")
Call viewer.setChart(c, cd.SVG)

' Include tool tip for the chart
viewer.ImageMap = c.getHTMLImageMap("", "", "title='{label}: US$ {value}M ({percent}%)'")
%>

<!DOCTYPE html>
<html>
<head>
    <title>3D Pyramid Chart</title>
    <!-- Include ChartDirector Javascript Library to support chart interactions -->
    <script type="text/javascript" src="cdjcv.js"></script>
</head>
<body style="margin:5px 0px 0px 5px">
    <div style="font:bold 18pt verdana;">
        3D Pyramid Chart
    </div>
    <hr style="border:solid 1px #000080; background:#000080" />
    <div style="font:10pt verdana; margin-bottom:1.5em">
        <a href="viewsource.asp?file=<%= Request("SCRIPT_NAME") %>">View Chart Source Code</a>
    </div>
    <!-- ****** Here is the chart image ****** -->
    <%= viewer.renderHTML() %>
</body>
</html>
[Windows Version (in Visual Basic)] vbdemo\threedpyramid.cls
Public Sub createChart(viewer As Object, chartIndex As Integer)

    Dim cd As New ChartDirector.API

    ' The data for the pyramid chart
    Dim data()
    data = Array(156, 123, 211, 179)

    ' The labels for the pyramid chart
    Dim labels()
    labels = Array("Corporate Tax", "Working Capital", "Re-investment", "Dividend")

    ' The colors for the pyramid layers
    Dim colors()
    colors = Array(&H66aaee, &Heebb22, &Hcccccc, &Hcc88ff)

    ' Create a PyramidChart object of size 500 x 400 pixels
    Dim c As PyramidChart
    Set c = cd.PyramidChart(500, 400)

    ' Set the pyramid center at (200, 180), and width x height to 150 x 300 pixels
    Call c.setPyramidSize(200, 180, 150, 300)

    ' Set the elevation to 15 degrees
    Call c.setViewAngle(15)

    ' Set the pyramid data and labels
    Call c.setData(data, labels)

    ' Set the layer colors to the given colors
    Call c.setColors2(cd.DataColor, colors)

    ' Leave 1% gaps between layers
    Call c.setLayerGap(0.01)

    ' Add labels at the center of the pyramid layers using Arial Bold font. The labels will show the
    ' percentage of the layers.
    Call c.setCenterLabel("{percent}%", "arialbd.ttf")

    ' Add labels at the right side of the pyramid layers using Arial Bold font. The labels will have
    ' two lines showing the layer name and value.
    Call c.setRightLabel("{label}<*br*>US$ {value}M", "arialbd.ttf")

    ' Output the chart
    Set viewer.Picture = c.makePicture()

    'include tool tip for the chart
    viewer.ImageMap = c.getHTMLImageMap("clickable", "", _
        "title='{label}: US$ {value}M ({percent}%)'")

End Sub
© 2021 Advanced Software Engineering Limited. All rights reserved.