[Web Version (in ASP)] aspdemo\threedscatter.asp
<%@ language="vbscript" %>
<%
Set cd = CreateObject("ChartDirector.API")
' The XYZ data for the 3D scatter chart as 3 random data series
Set r = cd.RanSeries(0)
xData = r.getSeries2(100, 100, -10, 10)
yData = r.getSeries2(100, 0, 0, 20)
zData = r.getSeries2(100, 100, -10, 10)
' Create a ThreeDScatterChart object of size 720 x 600 pixels
Set c = cd.ThreeDScatterChart(720, 600)
' Add a title to the chart using 20 points Times New Roman Italic font
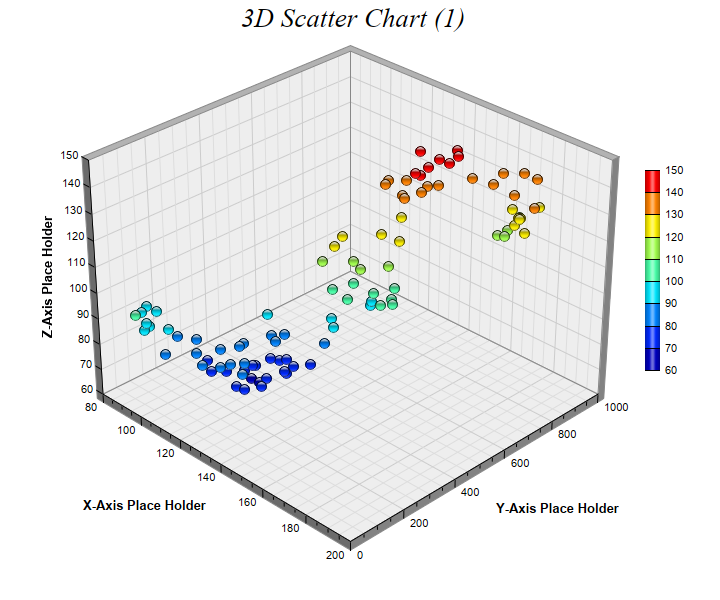
Call c.addTitle("3D Scatter Chart (1) ", "Times New Roman Italic", 20)
' Set the center of the plot region at (350, 280), and set width x depth x height to 360 x 360 x 270
' pixels
Call c.setPlotRegion(350, 280, 360, 360, 270)
' Add a scatter group to the chart using 11 pixels glass sphere symbols, in which the color depends
' on the z value of the symbol
Call c.addScatterGroup(xData, yData, zData, "", cd.GlassSphere2Shape, 11, cd.SameAsMainColor)
' Add a color axis (the legend) in which the left center is anchored at (645, 270). Set the length
' to 200 pixels and the labels on the right side.
Call c.setColorAxis(645, 270, cd.Left, 200, cd.Right)
' Set the x, y and z axis titles using 10 points Arial Bold font
Call c.xAxis().setTitle("X-Axis Place Holder", "Arial Bold", 10)
Call c.yAxis().setTitle("Y-Axis Place Holder", "Arial Bold", 10)
Call c.zAxis().setTitle("Z-Axis Place Holder", "Arial Bold", 10)
' Output the chart
Set viewer = cd.WebChartViewer(Request, "chart1")
Call viewer.setChart(c, cd.SVG)
' Include tool tip for the chart
viewer.ImageMap = c.getHTMLImageMap("", "", "title='<*cdml*>x={x|p}, y={y|p}, z={z|p}'")
%>
<!DOCTYPE html>
<html>
<head>
<title>3D Scatter Chart (1)</title>
<!-- Include ChartDirector Javascript Library to support chart interactions -->
<script type="text/javascript" src="cdjcv.js"></script>
</head>
<body style="margin:5px 0px 0px 5px">
<div style="font:bold 18pt verdana;">
3D Scatter Chart (1)
</div>
<hr style="border:solid 1px #000080; background:#000080" />
<div style="font:10pt verdana; margin-bottom:1.5em">
<a href="viewsource.asp?file=<%= Request("SCRIPT_NAME") %>">View Chart Source Code</a>
</div>
<!-- ****** Here is the chart image ****** -->
<%= viewer.renderHTML() %>
</body>
</html>
[Windows Version (in Visual Basic)] vbdemo\threedscatter.cls
Public Sub createChart(viewer As Object, chartIndex As Integer)

    Dim cd As New ChartDirector.API

    ' The XYZ data for the 3D scatter chart as 3 random data series
    Dim r As RanSeries
    Set r = cd.RanSeries(0)
    Dim xData()
    xData = r.getSeries2(100, 100, -10, 10)
    Dim yData()
    yData = r.getSeries2(100, 0, 0, 20)
    Dim zData()
    zData = r.getSeries2(100, 100, -10, 10)

    ' Create a ThreeDScatterChart object of size 720 x 600 pixels
    Dim c As ThreeDScatterChart
    Set c = cd.ThreeDScatterChart(720, 600)

    ' Add a title to the chart using 20 points Times New Roman Italic font
    Call c.addTitle("3D Scatter Chart (1)  ", "timesi.ttf", 20)

    ' Set the center of the plot region at (350, 280), and set width x depth x height to 360 x 360 x
    ' 270 pixels
    Call c.setPlotRegion(350, 280, 360, 360, 270)

    ' Add a scatter group to the chart using 11 pixels glass sphere symbols, in which the color
    ' depends on the z value of the symbol
    Call c.addScatterGroup(xData, yData, zData, "", cd.GlassSphere2Shape, 11, cd.SameAsMainColor)

    ' Add a color axis (the legend) in which the left center is anchored at (645, 270). Set the
    ' length to 200 pixels and the labels on the right side.
    Call c.setColorAxis(645, 270, cd.Left, 200, cd.Right)

    ' Set the x, y and z axis titles using 10 points Arial Bold font
    Call c.xAxis().setTitle("X-Axis Place Holder", "arialbd.ttf", 10)
    Call c.yAxis().setTitle("Y-Axis Place Holder", "arialbd.ttf", 10)
    Call c.zAxis().setTitle("Z-Axis Place Holder", "arialbd.ttf", 10)

    ' Output the chart
    Set viewer.Picture = c.makePicture()

    'include tool tip for the chart
    viewer.ImageMap = c.getHTMLImageMap("clickable", "", "title='(x={x|p}, y={y|p}, z={z|p}'")

End Sub
© 2021 Advanced Software Engineering Limited. All rights reserved.