This example demonstrates how to control the axis tick density in auto-scaling.
By default, in auto-scaling, ChartDirector automatically chooses the tick spacing for the axis.
In some cases, you may want to suggest the tick spacing to use. This can be done by using
Axis.setTickDensity.
Note that the actual tick spacing chosen by ChartDirector may not be equal to the suggested tick spacing. The suggested tick spacing is only a lower bound. It is because there may be other constraints when choosing the ticks. For example, the tick positions should be "neat numbers", such as (0, 5, 10, ...), and not arbitrary numbers like (0, 4.792, 9.584, ...). Also, by default, the axis starts and ends at tick positions (configurable using
Axis.setRounding), which means the axis length must be divisible by the tick spacing. These and other constraints will affect the exact ticks being chosen.
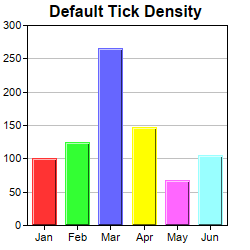
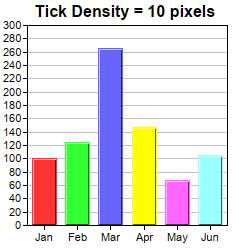
In this example, one of the charts is drawn using the default tick spacing. The other chart is drawn using a suggested tick spacing of 10 pixels. Note that the actual tick spacing is slightly larger than 10 pixels.
[Web Version (in ASP)] aspdemo\ticks.asp
<%@ language="vbscript" %>
<%
Set cd = CreateObject("ChartDirector.API")

' This script can draw different charts depending on the chartIndex
Sub createChart(viewer, chartIndex)

    ' The data for the chart
    data = Array(100, 125, 265, 147, 67, 105)
    labels = Array("Jan", "Feb", "Mar", "Apr", "May", "Jun")

    ' Create a XYChart object of size 250 x 250 pixels
    Set c = cd.XYChart(250, 250)

    ' Set the plot area at (27, 25) and of size 200 x 200 pixels
    Call c.setPlotArea(27, 25, 200, 200)

    If chartIndex = 1 Then
        ' High tick density, uses 10 pixels as tick spacing
        Call c.addTitle("Tick Density = 10 pixels")
        Call c.yAxis().setTickDensity(10)
    Else
        ' Normal tick density, just use the default setting
        Call c.addTitle("Default Tick Density")
    End If

    ' Set the labels on the x axis
    Call c.xAxis().setLabels(labels)

    ' Add a color bar layer using the given data. Use a 1 pixel 3D border for the bars.
    Call c.addBarLayer3(data).setBorderColor(-1, 1)

    ' Output the chart
    Call viewer.setChart(c, cd.SVG)

    ' Include tool tip for the chart
    viewer.ImageMap = c.getHTMLImageMap("", "", "title='Revenue for {xLabel}: US${value}M'")
End Sub

' This example includes 2 charts
Dim viewers(1)
For i = 0 To Ubound(viewers)
    Set viewers(i) = cd.WebChartViewer(Request, "chart" & i)
    Call createChart(viewers(i), i)
Next
%>

<!DOCTYPE html>
<html>
<head>
    <title>Tick Density</title>
    <!-- Include ChartDirector Javascript Library to support chart interactions -->
    <script type="text/javascript" src="cdjcv.js"></script>
</head>
<body style="margin:5px 0px 0px 5px">
    <div style="font:bold 18pt verdana;">
        Tick Density
    </div>
    <hr style="border:solid 1px #000080; background:#000080" />
    <div style="font:10pt verdana; margin-bottom:1.5em">
        <a href="viewsource.asp?file=<%= Request("SCRIPT_NAME") %>">View Chart Source Code</a>
    </div>
    <!-- ****** Here are the chart images ****** -->
    <%
        For i = 0 To Ubound(viewers)
            Call Response.Write(viewers(i).renderHTML())
            Call Response.Write(" ")
        Next
    %>
</body>
</html>
[Windows Version (in Visual Basic)] vbdemo\ticks.cls
Public Sub createChart(viewer As Object, chartIndex As Integer)

    Dim cd As New ChartDirector.API

    ' The data for the chart
    Dim data()
    data = Array(100, 125, 265, 147, 67, 105)
    Dim labels()
    labels = Array("Jan", "Feb", "Mar", "Apr", "May", "Jun")

    ' Create a XYChart object of size 250 x 250 pixels
    Dim c As XYChart
    Set c = cd.XYChart(250, 250)

    ' Set the plot area at (27, 25) and of size 200 x 200 pixels
    Call c.setPlotArea(27, 25, 200, 200)

    If chartIndex = 1 Then
        ' High tick density, uses 10 pixels as tick spacing
        Call c.addTitle("Tick Density = 10 pixels")
        Call c.yAxis().setTickDensity(10)
    Else
        ' Normal tick density, just use the default setting
        Call c.addTitle("Default Tick Density")
    End If

    ' Set the labels on the x axis
    Call c.xAxis().setLabels(labels)

    ' Add a color bar layer using the given data. Use a 1 pixel 3D border for the bars.
    Call c.addBarLayer3(data).setBorderColor(-1, 1)

    ' Output the chart
    Set viewer.Picture = c.makePicture()

    'include tool tip for the chart
    viewer.ImageMap = c.getHTMLImageMap("clickable", "", _
        "title='Revenue for {xLabel}: US${value}M'")

End Sub
© 2021 Advanced Software Engineering Limited. All rights reserved.