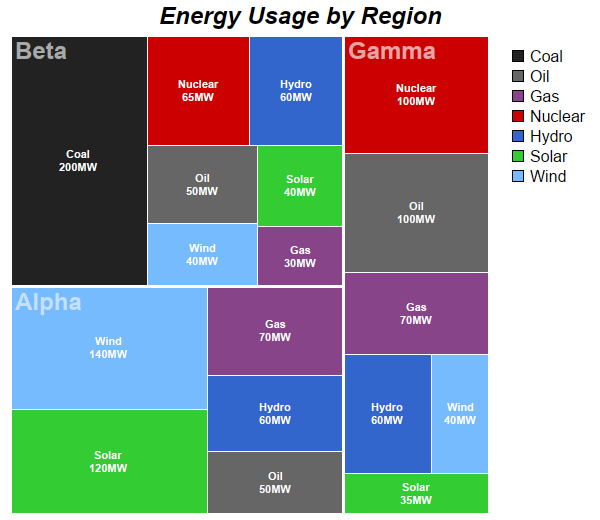
This example demonstrates an alternative color scheme for multi-level tree maps.
In the Multi Level Tree Map example, the colors are based on the first level nodes. This example demonstrates how to color based on second level nodes.
ChartDirector 7.0 (ASP/COM/VB Edition)
Tree Map Colors
Source Code Listing
<%@ language="vbscript" %>
<%
Set cd = CreateObject("ChartDirector.API")

' The first level nodes of the tree map. There are 3 nodes.
allRegions = Array("Alpha", "Beta", "Gamma")

' Each first level node branches to become 7 second level nodes.
energy_types = Array("Coal", "Oil", "Gas", "Nuclear", "Hydro", "Solar", "Wind")

' Colors for the second level nodes.
colors = Array(&H222222, &H666666, &H884488, &Hcc0000, &H3366cc, &H33cc33, &H77bbff)

' The data for the 3 groups of second level nodes
region0 = Array(0, 50, 70, 0, 60, 120, 140)
region1 = Array(200, 50, 30, 65, 60, 40, 40)
region2 = Array(0, 100, 70, 100, 60, 35, 40)

' Create a Tree Map object of size 600 x 520 pixels
Set c = cd.TreeMapChart(600, 520)

' Add a title to the chart
Call c.addTitle("Energy Usage by Region", "Arial Bold Italic", 18)

' Set the plotarea at (10, 35) and of size 480 x 480 pixels
Call c.setPlotArea(10, 35, 480, 480)

' Obtain the root of the tree map, which is the entire plot area
Set root = c.getRootNode()

' Add first level nodes to the root. We do not need to provide data as they will be computed as the
' sum of the second level nodes.
Call root.setData(Empty, allRegions)

' Add second level nodes to each of the first level node
Call root.getNode(0).setData(region0, energy_types, colors)
Call root.getNode(1).setData(region1, energy_types, colors)
Call root.getNode(2).setData(region2, energy_types, colors)

' Get the prototype (template) for the first level nodes.
Set nodeConfig = c.getLevelPrototype(1)

' Set the label format for the nodes to show the label with 8pt Arial Bold font in semi-transparent
' black color (0x77000000). Put the text at the top left corner of the cell.
Call nodeConfig.setLabelFormat("{label}", "Arial Bold", 18, &H77ffffff, cd.TopLeft)

' Set the border color to white (ffffff). Use 2 pixel thick flat border style.
Call nodeConfig.setColors(-1, &Hffffff, cd.flatBorder(2))

' Get the prototype (template) for the second level nodes.
Set nodeConfig2 = c.getLevelPrototype(2)

' Set the label format for the nodes to show the label and value with 8pt Arial Bold font. Put the
' text at the center of the cell.
Call nodeConfig2.setLabelFormat("{label}<*br*>{value}MW", "Arial Bold", 8, &Hffffff, cd.Center)

' Set the border color to white (ffffff)
Call nodeConfig2.setColors(-1, &Hffffff)

' Add a legend box at (500, 35) with 12pt Arial font and transparent background and border.
Set b = c.addLegend(500, 35, True, "Arial", 12)
Call b.setBackground(cd.Transparent, cd.Transparent)

' Add the legend keys for the colors
For i = 0 To UBound(energy_types)
    Call b.addKey(energy_types(i), colors(i))
Next

' Output the chart
Set viewer = cd.WebChartViewer(Request, "chart1")
Call viewer.setChart(c, cd.SVG)

' Include tool tip for the chart
viewer.ImageMap = c.getHTMLImageMap("", "", "title='<*cdml*>[{parent.label}] {label}: {value}MW'")
%>

<!DOCTYPE html>
<html>
<head>
    <title>Tree Map Colors</title>
    <!-- Include ChartDirector Javascript Library to support chart interactions -->
    <script type="text/javascript" src="cdjcv.js"></script>
</head>
<body style="margin:5px 0px 0px 5px">
    <div style="font:bold 18pt verdana;">
        Tree Map Colors
    </div>
    <hr style="border:solid 1px #000080; background:#000080" />
    <div style="font:10pt verdana; margin-bottom:1.5em">
        <a href="viewsource.asp?file=<%= Request("SCRIPT_NAME") %>">View Chart Source Code</a>
    </div>
    <!-- ****** Here is the chart image ****** -->
    <%= viewer.renderHTML() %>
</body>
</html>