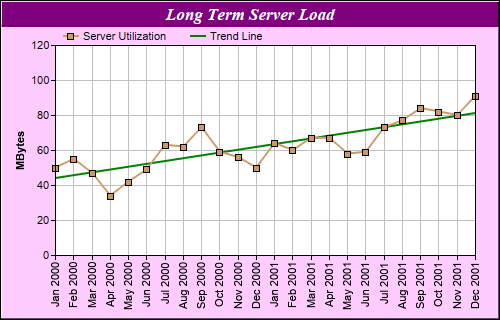
This example demonstrates linear regression trend line fitting. It also demonstrates rotating the x-axis labels by 90 degrees to save axis space.
A trend line is a straight line that best fit certain data points. A trend line is computed using linear regression (the least square method).
In ChartDirector, trend lines are created by using
XYChart.addTrendLayer or
XYChart.addTrendLayer2. A trend layer only shows the trend line, not the data points. Another layer, such as a line or scatter layer, can be used to show the data points.
In this example, two layers are used. A line layer displays the data points as symbols and draws a line that joins them. A trend layer draws a trend line that best fit the same data points.
Note that the x-axis labels are rotated by 90 degrees to save space. This is achieved by using
TextBox.setFontAngle of the
TextBox object that represents the x-axis label prototype.
[Web Version (in ASP)] aspdemo\trendline.asp
<%@ language="vbscript" %>
<%
Set cd = CreateObject("ChartDirector.API")

' The data for the line chart
data = Array(50, 55, 47, 34, 42, 49, 63, 62, 73, 59, 56, 50, 64, 60, 67, 67, 58, 59, 73, 77, 84, _
    82, 80, 91)

' The labels for the line chart
labels = Array("Jan 2000", "Feb 2000", "Mar 2000", "Apr 2000", "May 2000", "Jun 2000", "Jul 2000", _
    "Aug 2000", "Sep 2000", "Oct 2000", "Nov 2000", "Dec 2000", "Jan 2001", "Feb 2001", _
    "Mar 2001", "Apr 2001", "May 2001", "Jun 2001", "Jul 2001", "Aug 2001", "Sep 2001", _
    "Oct 2001", "Nov 2001", "Dec 2001")

' Create a XYChart object of size 500 x 320 pixels, with a pale purpule (0xffccff) background, a
' black border, and 1 pixel 3D border effect.
Set c = cd.XYChart(500, 320, &Hffccff, &H000000, 1)

' Set the plotarea at (55, 45) and of size 420 x 210 pixels, with white background. Turn on both
' horizontal and vertical grid lines with light grey color (0xc0c0c0)
Call c.setPlotArea(55, 45, 420, 210, &Hffffff, -1, -1, &Hc0c0c0, -1)

' Add a legend box at (55, 25) (top of the chart) with horizontal layout. Use 8pt Arial font. Set
' the background and border color to Transparent.
Call c.addLegend(55, 22, False, "", 8).setBackground(cd.Transparent)

' Add a title box to the chart using 13pt Times Bold Italic font. The text is white (0xffffff) on a
' purple (0x800080) background, with a 1 pixel 3D border.
Call c.addTitle("Long Term Server Load", "Times New Roman Bold Italic", 13, &Hffffff _
    ).setBackground(&H800080, -1, 1)

' Add a title to the y axis
Call c.yAxis().setTitle("MBytes")

' Set the labels on the x axis. Rotate the font by 90 degrees.
Call c.xAxis().setLabels(labels).setFontAngle(90)

' Add a line layer to the chart
Set lineLayer = c.addLineLayer()

' Add the data to the line layer using light brown color (0xcc9966) with a 7 pixel square symbol
Call lineLayer.addDataSet(data, &Hcc9966, "Server Utilization").setDataSymbol(cd.SquareSymbol, 7)

' Set the line width to 2 pixels
Call lineLayer.setLineWidth(2)

' tool tip for the line layer
Call lineLayer.setHTMLImageMap("", "", "title='{xLabel}: {value} MBytes'")

' Add a trend line layer using the same data with a dark green (0x008000) color. Set the line width
' to 2 pixels
Set trendLayer = c.addTrendLayer(data, &H008000, "Trend Line")
Call trendLayer.setLineWidth(2)

' tool tip for the trend layer
Call trendLayer.setHTMLImageMap("", "", "title='Change rate: {slope|2} MBytes/per month'")

' Output the chart
Set viewer = cd.WebChartViewer(Request, "chart1")
Call viewer.setChart(c, cd.SVG)

' include tool tip for the chart
viewer.ImageMap = c.getHTMLImageMap("")
%>

<!DOCTYPE html>
<html>
<head>
    <title>Trend Line Chart</title>
    <!-- Include ChartDirector Javascript Library to support chart interactions -->
    <script type="text/javascript" src="cdjcv.js"></script>
</head>
<body style="margin:5px 0px 0px 5px">
    <div style="font:bold 18pt verdana;">
        Trend Line Chart
    </div>
    <hr style="border:solid 1px #000080; background:#000080" />
    <div style="font:10pt verdana; margin-bottom:1.5em">
        <a href="viewsource.asp?file=<%= Request("SCRIPT_NAME") %>">View Chart Source Code</a>
    </div>
    <!-- ****** Here is the chart image ****** -->
    <%= viewer.renderHTML() %>
</body>
</html>
[Windows Version (in Visual Basic)] vbdemo\trendline.cls
Public Sub createChart(viewer As Object, chartIndex As Integer)

    Dim cd As New ChartDirector.API

    ' The data for the line chart
    Dim data()
    data = Array(50, 55, 47, 34, 42, 49, 63, 62, 73, 59, 56, 50, 64, 60, 67, 67, 58, 59, 73, 77, _
        84, 82, 80, 91)

    ' The labels for the line chart
    Dim labels()
    labels = Array("Jan 2000", "Feb 2000", "Mar 2000", "Apr 2000", "May 2000", "Jun 2000", _
        "Jul 2000", "Aug 2000", "Sep 2000", "Oct 2000", "Nov 2000", "Dec 2000", "Jan 2001", _
        "Feb 2001", "Mar 2001", "Apr 2001", "May 2001", "Jun 2001", "Jul 2001", "Aug 2001", _
        "Sep 2001", "Oct 2001", "Nov 2001", "Dec 2001")

    ' Create a XYChart object of size 500 x 320 pixels, with a pale purpule (0xffccff) background, a
    ' black border, and 1 pixel 3D border effect.
    Dim c As XYChart
    Set c = cd.XYChart(500, 320, &Hffccff, &H000000, 1)

    ' Set the plotarea at (55, 45) and of size 420 x 210 pixels, with white background. Turn on both
    ' horizontal and vertical grid lines with light grey color (0xc0c0c0)
    Call c.setPlotArea(55, 45, 420, 210, &Hffffff, -1, -1, &Hc0c0c0, -1)

    ' Add a legend box at (55, 25) (top of the chart) with horizontal layout. Use 8pt Arial font.
    ' Set the background and border color to Transparent.
    Call c.addLegend(55, 22, False, "", 8).setBackground(cd.Transparent)

    ' Add a title box to the chart using 13pt Times Bold Italic font. The text is white (0xffffff)
    ' on a purple (0x800080) background, with a 1 pixel 3D border.
    Call c.addTitle("Long Term Server Load", "timesbi.ttf", 13, &Hffffff).setBackground(&H800080, _
        -1, 1)

    ' Add a title to the y axis
    Call c.yAxis().setTitle("MBytes")

    ' Set the labels on the x axis. Rotate the font by 90 degrees.
    Call c.xAxis().setLabels(labels).setFontAngle(90)

    ' Add a line layer to the chart
    Dim lineLayer As LineLayer
    Set lineLayer = c.addLineLayer()

    ' Add the data to the line layer using light brown color (0xcc9966) with a 7 pixel square symbol
    Call lineLayer.addDataSet(data, &Hcc9966, "Server Utilization").setDataSymbol(cd.SquareSymbol,7)

    ' Set the line width to 2 pixels
    Call lineLayer.setLineWidth(2)

    ' tool tip for the line layer
    Call lineLayer.setHTMLImageMap("", "", "title='{xLabel}: {value} MBytes'")

    ' Add a trend line layer using the same data with a dark green (0x008000) color. Set the line
    ' width to 2 pixels
    Dim trendLayer As TrendLayer
    Set trendLayer = c.addTrendLayer(data, &H008000, "Trend Line")
    Call trendLayer.setLineWidth(2)

    ' tool tip for the trend layer
    Call trendLayer.setHTMLImageMap("", "", "title='Change rate: {slope|2} MBytes/per month'")

    ' Output the chart
    Set viewer.Picture = c.makePicture()

    ' include tool tip for the chart
    viewer.ImageMap = c.getHTMLImageMap("clickable")

End Sub
© 2021 Advanced Software Engineering Limited. All rights reserved.