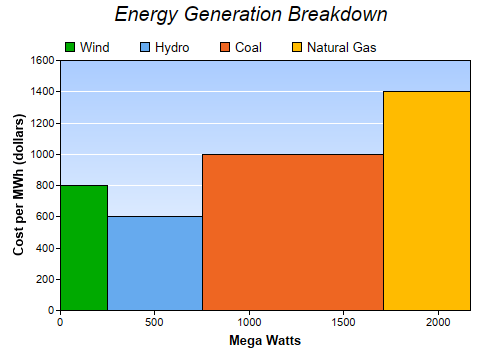
This example demonstrates a bar chart with variable bar widths.
ChartDirector does not really have a bar layer for variable width bars. However, an area layer can be used to create the same effect.
The variable width bars in this example are actually 4 areas, created by 4 area layers. The data set for each area layer consists of 4 points for the 4 corners of a bar.
[Web Version (in ASP)] aspdemo\varwidthbar.asp
<%@ language="vbscript" %>
<%
Set cd = CreateObject("ChartDirector.API")

' The data for the chart
data = Array(800, 600, 1000, 1400)
widths = Array(250, 500, 960, 460)
labels = Array("Wind", "Hydro", "Coal", "Natural Gas")

' The colors to use
colors = Array(&H00aa00, &H66aaee, &Hee6622, &Hffbb00)

' Create a XYChart object of size 500 x 350 pixels
Set c = cd.XYChart(500, 350)

' Add a title to the chart using 15pt Arial Italic font
Call c.addTitle("Energy Generation Breakdown", "Arial Italic", 15)

' Set the plotarea at (60, 60) and of (chart_width - 90) x (chart_height - 100) in size. Use a
' vertical gradient color from light blue (f9f9ff) to sky blue (aaccff) as background. Set grid
' lines to white (ffffff).
plotAreaBgColor = c.linearGradientColor(0, 60, 0, c.getHeight() - 40, &Haaccff, &Hf9fcff)
Call c.setPlotArea(60, 60, c.getWidth() - 90, c.getHeight() - 100, plotAreaBgColor, -1, -1, _
    &Hffffff)

' Add a legend box at (50, 30) using horizontal layout and transparent background.
Call c.addLegend(55, 30, False).setBackground(cd.Transparent)

' Add titles to x/y axes with 10 points Arial Bold font
Call c.xAxis().setTitle("Mega Watts", "Arial Bold", 10)
Call c.yAxis().setTitle("Cost per MWh (dollars)", "Arial Bold", 10)

' Set the x axis rounding to false, so that the x-axis will fit the data exactly
Call c.xAxis().setRounding(False, False)

' In ChartDirector, there is no bar layer that can have variable bar widths, but you may create a
' bar using an area layer. (A bar can be considered as the area under a rectangular outline.) So by
' using a loop to create one bar per area layer, we can achieve a variable width bar chart.

' starting position of current bar
currentX = 0

For i = 0 To UBound(data)
    ' ending position of current bar
    nextX = currentX + widths(i)

    ' outline of the bar
    dataX = Array(currentX, currentX, nextX, nextX)
    dataY = Array(0, data(i), data(i), 0)

    ' create the area layer to fill the bar
    Set layer = c.addAreaLayer(dataY, colors(i), labels(i))
    Call layer.setXData(dataX)

    ' Tool tip for the layer
    Call layer.setHTMLImageMap("", "", "title='" & labels(i) & ": " & widths(i) & " MW at $" & _
        data(i) & " per MWh'")

    ' the ending position becomes the starting position of the next bar
    currentX = nextX
Next

' Output the chart
Set viewer = cd.WebChartViewer(Request, "chart1")
Call viewer.setChart(c, cd.SVG)

' Include tool tip for the chart
viewer.ImageMap = c.getHTMLImageMap("")
%>

<!DOCTYPE html>
<html>
<head>
    <title>Variable Width Bar Chart</title>
    <!-- Include ChartDirector Javascript Library to support chart interactions -->
    <script type="text/javascript" src="cdjcv.js"></script>
</head>
<body style="margin:5px 0px 0px 5px">
    <div style="font:bold 18pt verdana;">
        Variable Width Bar Chart
    </div>
    <hr style="border:solid 1px #000080; background:#000080" />
    <div style="font:10pt verdana; margin-bottom:1.5em">
        <a href="viewsource.asp?file=<%= Request("SCRIPT_NAME") %>">View Chart Source Code</a>
    </div>
    <!-- ****** Here is the chart image ****** -->
    <%= viewer.renderHTML() %>
</body>
</html>
[Windows Version (in Visual Basic)] vbdemo\varwidthbar.cls
Public Sub createChart(viewer As Object, chartIndex As Integer)

    Dim cd As New ChartDirector.API

    ' The data for the chart
    Dim data()
    data = Array(800, 600, 1000, 1400)
    Dim widths()
    widths = Array(250, 500, 960, 460)
    Dim labels()
    labels = Array("Wind", "Hydro", "Coal", "Natural Gas")

    ' The colors to use
    Dim colors()
    colors = Array(&H00aa00, &H66aaee, &Hee6622, &Hffbb00)

    ' Create a XYChart object of size 500 x 350 pixels
    Dim c As XYChart
    Set c = cd.XYChart(500, 350)

    ' Add a title to the chart using 15pt Arial Italic font
    Call c.addTitle("Energy Generation Breakdown", "ariali.ttf", 15)

    ' Set the plotarea at (60, 60) and of (chart_width - 90) x (chart_height - 100) in size. Use a
    ' vertical gradient color from light blue (f9f9ff) to sky blue (aaccff) as background. Set grid
    ' lines to white (ffffff).
    Dim plotAreaBgColor As Long
    plotAreaBgColor = c.linearGradientColor(0, 60, 0, c.getHeight() - 40, &Haaccff, &Hf9fcff)
    Call c.setPlotArea(60, 60, c.getWidth() - 90, c.getHeight() - 100, plotAreaBgColor, -1, -1, _
        &Hffffff)

    ' Add a legend box at (50, 30) using horizontal layout and transparent background.
    Call c.addLegend(55, 30, False).setBackground(cd.Transparent)

    ' Add titles to x/y axes with 10 points Arial Bold font
    Call c.xAxis().setTitle("Mega Watts", "arialbd.ttf", 10)
    Call c.yAxis().setTitle("Cost per MWh (dollars)", "arialbd.ttf", 10)

    ' Set the x axis rounding to false, so that the x-axis will fit the data exactly
    Call c.xAxis().setRounding(False, False)

    ' In ChartDirector, there is no bar layer that can have variable bar widths, but you may create
    ' a bar using an area layer. (A bar can be considered as the area under a rectangular outline.)
    ' So by using a loop to create one bar per area layer, we can achieve a variable width bar
    ' chart.

    ' starting position of current bar
    Dim currentX As Double
    currentX = 0

    Dim i As Long
    For i = 0 To UBound(data)
        ' ending position of current bar
        Dim nextX As Double
        nextX = currentX + widths(i)

        ' outline of the bar
        Dim dataX()
        dataX = Array(currentX, currentX, nextX, nextX)
        Dim dataY()
        dataY = Array(0, data(i), data(i), 0)

        ' create the area layer to fill the bar
        Dim layer As AreaLayer
        Set layer = c.addAreaLayer(dataY, colors(i), labels(i))
        Call layer.setXData(dataX)

        ' Tool tip for the layer
        Call layer.setHTMLImageMap("", "", "title='" & labels(i) & ": " & widths(i) & " MW at $" & _
            data(i) & " per MWh'")

        ' the ending position becomes the starting position of the next bar
        currentX = nextX
    Next

    ' Output the chart
    Set viewer.Picture = c.makePicture()

    ' Include tool tip for the chart
    viewer.ImageMap = c.getHTMLImageMap("clickable")

End Sub
© 2021 Advanced Software Engineering Limited. All rights reserved.