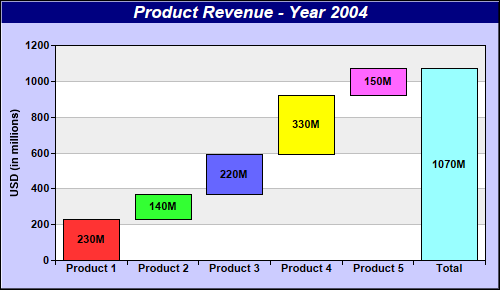
This example demonstrates creating a multi-color waterfall chart.
This chart is created as a multi-color box-whisker layer using
XYChart.addBoxWhiskerLayer2. Only the "box" part of the box-whisker layer is used.
The top-edges of the boxes are obtained by accumulating the raw data using the
ArrayMath utility. The bottom-edges of the boxes are simply the top-edges of previous boxes, with the exception of the last "total" box which always starts at 0.
[Web Version (in ASP)] aspdemo\waterfall.asp
<%@ language="vbscript" %>
<%
Set cd = CreateObject("ChartDirector.API")

' 4 data points to represent the cash flow for the Q1 - Q4
data = Array(230, 140, 220, 330, 150)

' We want to plot a waterfall chart showing the 4 quarters as well as the total
labels = Array("Product 1", "Product 2", "Product 3", "Product 4", "Product 5", "Total")

' The top side of the bars in a waterfall chart is the accumulated data. We use the ChartDirector
' ArrayMath utility to accumulate the data. The "total" is handled by inserting a zero point at the
' end before accumulation (after accumulation it will become the total).
boxTop = cd.ArrayMath(data).insert2(0, 1).acc().result()

' The botom side of the bars is just the top side of the previous bar. So we shifted the top side
' data to obtain the bottom side data.
boxBottom = cd.ArrayMath(boxTop).shift(1, 0).result()

' The last point (total) is different. Its bottom side is always 0.
boxBottom(UBound(boxBottom)) = 0

' Create a XYChart object of size 500 x 280 pixels. Set background color to light blue (ccccff),
' with 1 pixel 3D border effect.
Set c = cd.XYChart(500, 290, &Hccccff, &H000000, 1)

' Add a title to the chart using 13 points Arial Bold Itatic font, with white (ffffff) text on a
' deep blue (0x80) background
Call c.addTitle("Product Revenue - Year 2004", "Arial Bold Italic", 13, &Hffffff).setBackground( _
    &H000080)

' Set the plotarea at (55, 50) and of size 430 x 215 pixels. Use alternative white/grey background.
Call c.setPlotArea(55, 45, 430, 215, &Hffffff, &Heeeeee)

' Set the labels on the x axis using Arial Bold font
Call c.xAxis().setLabels(labels).setFontStyle("Arial Bold")

' Set the x-axis ticks and grid lines to be between the bars
Call c.xAxis().setTickOffset(0.5)

' Use Arial Bold as the y axis label font
Call c.yAxis().setLabelStyle("Arial Bold")

' Add a title to the y axis
Call c.yAxis().setTitle("USD (in millions)")

' Add a multi-color box-whisker layer to represent the waterfall bars
Set layer = c.addBoxWhiskerLayer2(boxTop, boxBottom)

' Put data labels on the bars to show the cash flow using Arial Bold font
Call layer.setDataLabelFormat("{={top}-{bottom}}M")
Call layer.setDataLabelStyle("Arial Bold").setAlignment(cd.Center)

' Output the chart
Set viewer = cd.WebChartViewer(Request, "chart1")
Call viewer.setChart(c, cd.SVG)

' Include tool tip for the chart
viewer.ImageMap = c.getHTMLImageMap("", "", "title='{xLabel}: {={top}-{bottom}} millions'")
%>

<!DOCTYPE html>
<html>
<head>
    <title>Waterfall Chart</title>
    <!-- Include ChartDirector Javascript Library to support chart interactions -->
    <script type="text/javascript" src="cdjcv.js"></script>
</head>
<body style="margin:5px 0px 0px 5px">
    <div style="font:bold 18pt verdana;">
        Waterfall Chart
    </div>
    <hr style="border:solid 1px #000080; background:#000080" />
    <div style="font:10pt verdana; margin-bottom:1.5em">
        <a href="viewsource.asp?file=<%= Request("SCRIPT_NAME") %>">View Chart Source Code</a>
    </div>
    <!-- ****** Here is the chart image ****** -->
    <%= viewer.renderHTML() %>
</body>
</html>
[Windows Version (in Visual Basic)] vbdemo\waterfall.cls
Public Sub createChart(viewer As Object, chartIndex As Integer)

    Dim cd As New ChartDirector.API

    ' 4 data points to represent the cash flow for the Q1 - Q4
    Dim data()
    data = Array(230, 140, 220, 330, 150)

    ' We want to plot a waterfall chart showing the 4 quarters as well as the total
    Dim labels()
    labels = Array("Product 1", "Product 2", "Product 3", "Product 4", "Product 5", "Total")

    ' The top side of the bars in a waterfall chart is the accumulated data. We use the
    ' ChartDirector ArrayMath utility to accumulate the data. The "total" is handled by inserting a
    ' zero point at the end before accumulation (after accumulation it will become the total).
    Dim boxTop()
    boxTop = cd.ArrayMath(data).insert2(0, 1).acc().result()

    ' The botom side of the bars is just the top side of the previous bar. So we shifted the top
    ' side data to obtain the bottom side data.
    Dim boxBottom()
    boxBottom = cd.ArrayMath(boxTop).shift(1, 0).result()

    ' The last point (total) is different. Its bottom side is always 0.
    boxBottom(UBound(boxBottom)) = 0

    ' Create a XYChart object of size 500 x 280 pixels. Set background color to light blue (ccccff),
    ' with 1 pixel 3D border effect.
    Dim c As XYChart
    Set c = cd.XYChart(500, 290, &Hccccff, &H000000, 1)

    ' Add a title to the chart using 13 points Arial Bold Itatic font, with white (ffffff) text on a
    ' deep blue (0x80) background
    Call c.addTitle("Product Revenue - Year 2004", "arialbi.ttf", 13, &Hffffff).setBackground( _
        &H000080)

    ' Set the plotarea at (55, 50) and of size 430 x 215 pixels. Use alternative white/grey
    ' background.
    Call c.setPlotArea(55, 45, 430, 215, &Hffffff, &Heeeeee)

    ' Set the labels on the x axis using Arial Bold font
    Call c.xAxis().setLabels(labels).setFontStyle("arialbd.ttf")

    ' Set the x-axis ticks and grid lines to be between the bars
    Call c.xAxis().setTickOffset(0.5)

    ' Use Arial Bold as the y axis label font
    Call c.yAxis().setLabelStyle("arialbd.ttf")

    ' Add a title to the y axis
    Call c.yAxis().setTitle("USD (in millions)")

    ' Add a multi-color box-whisker layer to represent the waterfall bars
    Dim layer As BoxWhiskerLayer
    Set layer = c.addBoxWhiskerLayer2(boxTop, boxBottom)

    ' Put data labels on the bars to show the cash flow using Arial Bold font
    Call layer.setDataLabelFormat("{={top}-{bottom}}M")
    Call layer.setDataLabelStyle("arialbd.ttf").setAlignment(cd.Center)

    ' Output the chart
    Set viewer.Picture = c.makePicture()

    'include tool tip for the chart
    viewer.ImageMap = c.getHTMLImageMap("clickable", "", _
        "title='{xLabel}: {={top}-{bottom}} millions'")

End Sub
© 2021 Advanced Software Engineering Limited. All rights reserved.