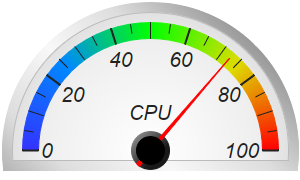
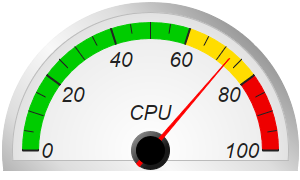
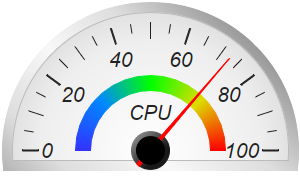
This example demonstrates semicircle meters with a soft white background and a silver border.
The white background in this example is actually a radial gradient. It is fully white at the center, changing to light grey at the border. This creates a "softer" white effect. The radial gradient is created using
AngularMeter.relativeRadialGradient.
The silver border effect is achieved by using
AngularMeter.relativeLinearGradient to create a gradient consisting of varying levels of grey.
The soft white gradient and the silver gradient are applied to the meter background and border using
AngularMeter.addScaleBackground.
Because the background and border color are similar, to make the border easier to distinguish from the background, the
AngularMeter.addScaleBackground is called one more time to add a 1-pixel grey boundary between the border and the background.
[Web Version (in ASP)] aspdemo\whitesemicirclemeter.asp
<%@ language="vbscript" %>
<%
Set cd = CreateObject("ChartDirector.API")
' This script can draw different charts depending on the chartIndex
Sub createChart(viewer, chartIndex)
' The value to display on the meter
value = 72.55
' Create an AngularMeter object of size 300 x 180 pixels with transparent background
Set m = cd.AngularMeter(300, 180, cd.Transparent)
' Set the default text and line colors to very dark grey (0x222222)
Call m.setColor(cd.TextColor, &H222222)
Call m.setColor(cd.LineColor, &H222222)
' Center at (150, 150), scale radius = 128 pixels, scale angle -90 to +90 degrees
Call m.setMeter(150, 150, 128, -90, 90)
' Gradient color for the border to make it silver-like
ringGradient = Array(1, &H999999, 0.5, &Hdddddd, 0, &Hf8f8f8, -0.5, &Hdddddd, -1, &H999999)
' Background gradient color from white (0xffffff) at the center to light grey (0xdddddd) at the
' border
bgGradient = Array(0, &Hffffff, 0.75, &Heeeeee, 1, &Hdddddd)
' Add a scale background of 148 pixels radius using the gradient background, with a 10 pixel
' thick silver border
Call m.addScaleBackground(148, m.relativeRadialGradient(bgGradient, 148), 10, _
m.relativeLinearGradient(ringGradient, 45, 148))
' Add a 1 pixel light grey (0xbbbbbb) line at the inner edge of the thick silver border (radius
' = 138) to enhance its contrast with the background gradient
Call m.addScaleBackground(138, cd.Transparent, 1, &Hbbbbbb)
' Meter scale is 0 - 100, with major tick every 20 units, minor tick every 10 units, and micro
' tick every 5 units
Call m.setScale(0, 100, 20, 10, 5)
' Set the scale label style to 15pt Arial Italic. Set the major/minor/micro tick lengths to
' 16/16/10 pixels pointing inwards, and their widths to 2/1/1 pixels.
Call m.setLabelStyle("Arial Italic", 16)
Call m.setTickLength(-16, -16, -10)
Call m.setLineWidth(0, 2, 1, 1)
' Demostrate different types of color scales and putting them at different positions
smoothColorScale = Array(0, &H3333ff, 25, &H0088ff, 50, &H00ff00, 75, &Hdddd00, 100, &Hff0000)
stepColorScale = Array(0, &H00cc00, 60, &Hffdd00, 80, &Hee0000, 100)
highLowColorScale = Array(0, &H00ff00, 70, cd.Transparent, 100, &Hff0000)
If chartIndex = 0 Then
' Add the smooth color scale at the default position
Call m.addColorScale(smoothColorScale)
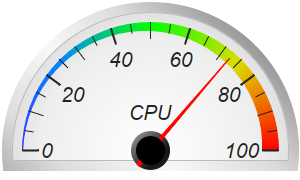
ElseIf chartIndex = 1 Then
' Add the smooth color scale starting at radius 128 with zero width and ending at radius 128
' with 16 pixels inner width
Call m.addColorScale(smoothColorScale, 128, 0, 128, -16)
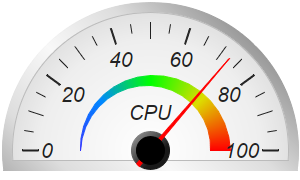
ElseIf chartIndex = 2 Then
' Add the smooth color scale starting at radius 70 with zero width and ending at radius 60
' with 20 pixels outer width
Call m.addColorScale(smoothColorScale, 70, 0, 60, 20)
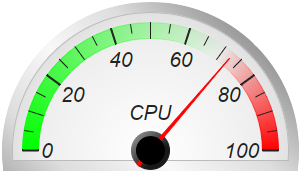
ElseIf chartIndex = 3 Then
' Add the high/low color scale at the default position
Call m.addColorScale(highLowColorScale)
ElseIf chartIndex = 4 Then
' Add the step color scale at the default position
Call m.addColorScale(stepColorScale)
Else
' Add the smooth color scale at radius 60 with 15 pixels outer width
Call m.addColorScale(smoothColorScale, 60, 15)
End If
' Add a text label centered at (150, 125) with 15pt Arial Italic font
Call m.addText(150, 125, "CPU", "Arial Italic", 15, cd.TextColor, cd.BottomCenter)
' Add a red (0xff0000) pointer at the specified value
Call m.addPointer2(value, &Hff0000)
' Output the chart
Call viewer.setChart(m, cd.SVG)
End Sub
' This example includes 6 charts
Dim viewers(5)
For i = 0 To Ubound(viewers)
Set viewers(i) = cd.WebChartViewer(Request, "chart" & i)
Call createChart(viewers(i), i)
Next
%>
<!DOCTYPE html>
<html>
<head>
<title>White Semicircle Meters</title>
<!-- Include ChartDirector Javascript Library to support chart interactions -->
<script type="text/javascript" src="cdjcv.js"></script>
</head>
<body style="margin:5px 0px 0px 5px">
<div style="font:bold 18pt verdana;">
White Semicircle Meters
</div>
<hr style="border:solid 1px #000080; background:#000080" />
<div style="font:10pt verdana; margin-bottom:1.5em">
<a href="viewsource.asp?file=<%= Request("SCRIPT_NAME") %>">View Chart Source Code</a>
</div>
<!-- ****** Here are the chart images ****** -->
<%
For i = 0 To Ubound(viewers)
Call Response.Write(viewers(i).renderHTML())
Call Response.Write(" ")
Next
%>
</body>
</html>
[Windows Version (in Visual Basic)] vbdemo\whitesemicirclemeter.cls
Public Sub createChart(viewer As Object, chartIndex As Integer)

    Dim cd As New ChartDirector.API

    ' The value to display on the meter
    Dim value As Double
    value = 72.55

    ' Create an AngularMeter object of size 300 x 180 pixels
    Dim m As AngularMeter
    Set m = cd.AngularMeter(300, 180)

    ' Set the default text and line colors to very dark grey (0x222222)
    Call m.setColor(cd.TextColor, &H222222)
    Call m.setColor(cd.LineColor, &H222222)

    ' Center at (150, 150), scale radius = 128 pixels, scale angle -90 to +90 degrees
    Call m.setMeter(150, 150, 128, -90, 90)

    ' Gradient color for the border to make it silver-like
    Dim ringGradient()
    ringGradient = Array(1, &H999999, 0.5, &Hdddddd, 0, &Hf8f8f8, -0.5, &Hdddddd, -1, &H999999)

    ' Background gradient color from white (0xffffff) at the center to light grey (0xdddddd) at the
    ' border
    Dim bgGradient()
    bgGradient = Array(0, &Hffffff, 0.75, &Heeeeee, 1, &Hdddddd)

    ' Add a scale background of 148 pixels radius using the gradient background, with a 10 pixel
    ' thick silver border
    Call m.addScaleBackground(148, m.relativeRadialGradient(bgGradient, 148), 10, _
        m.relativeLinearGradient(ringGradient, 45, 148))

    ' Add a 1 pixel light grey (0xbbbbbb) line at the inner edge of the thick silver border (radius
    ' = 138) to enhance its contrast with the background gradient
    Call m.addScaleBackground(138, cd.Transparent, 1, &Hbbbbbb)

    ' Meter scale is 0 - 100, with major tick every 20 units, minor tick every 10 units, and micro
    ' tick every 5 units
    Call m.setScale(0, 100, 20, 10, 5)

    ' Set the scale label style to 15pt Arial Italic. Set the major/minor/micro tick lengths to
    ' 16/16/10 pixels pointing inwards, and their widths to 2/1/1 pixels.
    Call m.setLabelStyle("ariali.ttf", 16)
    Call m.setTickLength(-16, -16, -10)
    Call m.setLineWidth(0, 2, 1, 1)

    ' Demostrate different types of color scales and putting them at different positions
    Dim smoothColorScale()
    smoothColorScale = Array(0, &H3333ff, 25, &H0088ff, 50, &H00ff00, 75, &Hdddd00, 100, &Hff0000)
    Dim stepColorScale()
    stepColorScale = Array(0, &H00cc00, 60, &Hffdd00, 80, &Hee0000, 100)
    Dim highLowColorScale()
    highLowColorScale = Array(0, &H00ff00, 70, cd.Transparent, 100, &Hff0000)

    If chartIndex = 0 Then
        ' Add the smooth color scale at the default position
        Call m.addColorScale(smoothColorScale)
    ElseIf chartIndex = 1 Then
        ' Add the smooth color scale starting at radius 128 with zero width and ending at radius 128
        ' with 16 pixels inner width
        Call m.addColorScale(smoothColorScale, 128, 0, 128, -16)
    ElseIf chartIndex = 2 Then
        ' Add the smooth color scale starting at radius 70 with zero width and ending at radius 60
        ' with 20 pixels outer width
        Call m.addColorScale(smoothColorScale, 70, 0, 60, 20)
    ElseIf chartIndex = 3 Then
        ' Add the high/low color scale at the default position
        Call m.addColorScale(highLowColorScale)
    ElseIf chartIndex = 4 Then
        ' Add the step color scale at the default position
        Call m.addColorScale(stepColorScale)
    Else
        ' Add the smooth color scale at radius 60 with 15 pixels outer width
        Call m.addColorScale(smoothColorScale, 60, 15)
    End If

    ' Add a text label centered at (150, 125) with 15pt Arial Italic font
    Call m.addText(150, 125, "CPU", "ariali.ttf", 15, cd.TextColor, cd.BottomCenter)

    ' Add a red (0xff0000) pointer at the specified value
    Call m.addPointer2(value, &Hff0000)

    ' Output the chart
    Set viewer.Picture = m.makePicture()

End Sub
© 2021 Advanced Software Engineering Limited. All rights reserved.