[
Windows Version (in Visual Basic)] vbdemo\frmZoomScrollDemo.frm
Option Explicit
Private cd As New ChartDirector.API
' Data arrays for the scrollable / zoomable chart.
Private timeStamps()
Private dataSeriesA()
Private dataSeriesB()
Private dataSeriesC()
' The earliest date and the duration in seconds for horizontal scrolling
Private minDate As Date
Private dateRange As Double
' The vertical range of the chart for vertical scrolling
Private maxValue As Double
Private minValue As Double
' The current visible duration of the view port in seconds
Private currentDuration As Double
' In this demo, the maximum zoom-in is set to 10 days
Private minDuration As Double
' A flag to track if the user has entered into the duration combo box
Private durationHasChanged As Boolean
'
' Visual Basic 6 does not have a built in binary search function, so we need to write
' one ourselves.
'
' This binary search function will return the lower index if there is no exact match.
' For example, if the target is between elements 3 and 4, it will return 3. If the
' target is beyond the first element of the array, it will return LBound(arr) - 1.
'
Private Function binarySearch(arr, target)
Dim lowerIndex As Long
Dim upperIndex As Long
Dim midIndex As Long
Dim isAscending As Long
lowerIndex = LBound(arr)
upperIndex = UBound(arr)
isAscending = Sgn(arr(upperIndex) - arr(lowerIndex))
Do While lowerIndex <= upperIndex
midIndex = (lowerIndex + upperIndex) / 2
Select Case Sgn(arr(midIndex) - target) * isAscending
Case 0
binarySearch = midIndex
Exit Function
Case -1
lowerIndex = midIndex + 1
Case 1
upperIndex = midIndex - 1
End Select
Loop
binarySearch = IIf(lowerIndex > upperIndex, upperIndex, lowerIndex)
End Function
'
' Initialize the Form
'
Private Sub Form_Load()
' Load the data
loadData
' In this demo, we deduce the horizontal scroll range from the actual data.
minDate = timeStamps(0)
dateRange = DateDiff("s", minDate, timeStamps(UBound(timeStamps)))
' In this demo, the maximum zoom-in is set to 10 days (1 day = 86400 seconds)
minDuration = 10 * 86400
' Set ChartViewer to reflect the visible and minimum duration
ChartViewer1.ZoomInWidthLimit = minDuration / dateRange
ChartViewer1.ViewportWidth = currentDuration / dateRange
ChartViewer1.ViewportLeft = 1 - ChartViewer1.ViewportWidth
' Initially choose the pointer mode (drag to scroll mode)
PointerPB_Click
XZoomPB_Click
End Sub
'
' Load the data
'
Private Sub loadData()
' In this demo, we allow scrolling the chart for the last 5 years
Dim lastDate As Date
lastDate = Date
Dim firstDate As Date
firstDate = DateAdd("yyyy", -5, lastDate)
' The initial view port is to show 1 year of data.
Dim viewPortStartDate As Date
viewPortStartDate = DateAdd("yyyy", -1, lastDate)
currentDuration = DateDiff("s", viewPortStartDate, lastDate)
'
' Get the data and stores them in a memory buffer for fast scrolling / zooming. In
' this demo, we just use a random number generator. In practice, you may get the data
' from a database or XML or by other means. (See the ChartDirector documentation on
' "Using Data Sources with ChartDirector" if you need some sample code on how to read
' data from database to array variables.)
'
' Set up random number generator
Dim noOfDays As Integer
noOfDays = DateDiff("d", firstDate, lastDate) + 1
Dim r As rantable
Set r = cd.rantable(127, 4, noOfDays)
Call r.setDateCol(0, firstDate, 86400)
Call r.setCol(1, 150, -10, 10)
Call r.setCol(2, 200, -10, 10)
Call r.setCol(3, 250, -10, 10)
' Read random data into the data arrays
timeStamps = cd.NTime(r.getCol(0))
dataSeriesA = r.getCol(1)
dataSeriesB = r.getCol(2)
dataSeriesC = r.getCol(3)
End Sub
'
' User clicks on the Pointer pushbutton
'
Private Sub PointerPB_Click()
ChartViewer1.MouseUsage = cvScrollOnDrag
End Sub
'
' User clicks on the Zoom In pushbutton
'
Private Sub ZoomInPB_Click()
ChartViewer1.MouseUsage = cvZoomIn
End Sub
'
' User clicks on the Zoom Out pushbutton
'
Private Sub ZoomOutPB_Click()
ChartViewer1.MouseUsage = cvZoomOut
End Sub
'
' User clicks on the X-Zoom pushbutton
'
Private Sub XZoomPB_Click()
ChartViewer1.ScrollDirection = cvHorizontal
ChartViewer1.ZoomDirection = cvHorizontal
' Viewport is always unzoomed as y-axis is auto-scaled
ChartViewer1.ViewportTop = 0
ChartViewer1.ViewportHeight = 1
' Update chart to auto-scale axis
Call ChartViewer1.UpdateViewPort(True, True)
End Sub
'
' User clicks on the XY-Zoom pushbutton
'
Private Sub XYZoomPB_Click()
ChartViewer1.ScrollDirection = cvHorizontalVertical
ChartViewer1.ZoomDirection = cvHorizontalVertical
End Sub
'
' User selects a start date from the date/time picker control
'
Private Sub StartDate_Change()
' Compute the new view port position based on the selected date
ChartViewer1.ViewportLeft = DateDiff("s", minDate, StartDate.value) / dateRange
Call ChartViewer1.UpdateViewPort(True, True)
End Sub
'
' User selects a duration from the Duration combo box
'
Private Sub Duration_Click()
durationHasChanged = False
' Validate user input
Dim enteredDuration As Double
On Error GoTo FormatError
enteredDuration = CDbl(Duration.Text) * 86400
On Error GoTo 0
If enteredDuration <= minDuration Then
enteredDuration = minDuration
End If
' Check if duration has really changed - sometimes the combo box may issue
' redundant value changed events when value has not actually changed.
Dim newViewPortWidth As Double
newViewPortWidth = enteredDuration / dateRange
If (Abs(ChartViewer1.ViewportWidth - newViewPortWidth) > _
0.00001 * ChartViewer1.ViewportWidth) Then
' Set the view port based on the duration
ChartViewer1.ViewportWidth = newViewPortWidth
Call ChartViewer1.UpdateViewPort(True, True)
End If
Exit Sub
FormatError:
Duration.Text = Int(0.5 + ChartViewer1.ViewportWidth * dateRange / 86400)
durationHasChanged = False
End Sub
'
' The Duration combo box lost focus (User may have entered a new duration.)
'
Private Sub Duration_LostFocus()
If durationHasChanged Then
Duration_Click
End If
End Sub
'
' User presses "Enter" key. (User may have entered a new duration.)
'
Private Sub Duration_KeyPress(KeyAscii As Integer)
If KeyAscii = 13 Then
Duration_LostFocus
Else
durationHasChanged = True
End If
End Sub
'
' User clicks on the the horizontal scroll bar
'
Private Sub HScrollBar1_Change()
Call HScrollBar1_Scroll
End Sub
Private Sub HScrollBar1_Scroll()
' Set the view port based on the scroll bar
ChartViewer1.ViewportLeft = CDbl(HScrollBar1.value - HScrollBar1.Min) / _
(HScrollBar1.Max - HScrollBar1.Min) * (1 - ChartViewer1.ViewportWidth)
Call ChartViewer1.UpdateViewPort(True, False)
End Sub
'
' User clicks on the the vertical scroll bar
'
Private Sub VScrollBar1_Change()
Call VScrollBar1_Scroll
End Sub
Private Sub VScrollBar1_Scroll()
' Set the view port based on the scroll bar
ChartViewer1.ViewportTop = CDbl(VScrollBar1.value - VScrollBar1.Min) / _
(VScrollBar1.Max - VScrollBar1.Min) * (1 - ChartViewer1.ViewportHeight)
Call ChartViewer1.UpdateViewPort(True, False)
End Sub
'
' Mouse moves over ChartViewer
'
Private Sub ChartViewer1_MouseMove(Button As Integer, Shift As Integer, X As Single, Y As Single)
If Button = 0 Then
' Mouse is over chart with mouse button released (not dragging)
' Update image map if necessary
Call updateImageMap(ChartViewer1)
End If
End Sub
'
' User clicks on a hot spot on the chart
'
Private Sub ChartViewer1_ClickHotSpot(hotSpot As Collection, Button As Integer, Shift As Integer, _
X As Single, Y As Single)
' We show the pop up dialog only when the mouse action is not zoom in or zoom out
If ChartViewer1.MouseUsage <> cvZoomIn And ChartViewer1.MouseUsage <> cvZoomOut Then
'In this demo, just list out the information provided by ChartDirector about hot spot
ParamViewer.Display hotSpot
End If
End Sub
'
' ChartViewer ViewPortChanged event
'
Private Sub ChartViewer1_ViewPortChanged(needUpdateChart As Boolean, needUpdateImageMap As Boolean)
' Set the date/time picker and duration box to reflect the current view port
StartDate.value = DateAdd("s", ChartViewer1.ViewportLeft * dateRange, minDate)
Duration.Text = Int(0.5 + dateRange * ChartViewer1.ViewportWidth / 86400)
' Set the horizontal scroll bar to reflect the current view port
HScrollBar1.Enabled = ChartViewer1.ViewportWidth < 1
If HScrollBar1.Enabled Then
HScrollBar1.LargeChange = Int(ChartViewer1.ViewportWidth * _
(HScrollBar1.Max - HScrollBar1.Min) + 0.99999999999)
HScrollBar1.SmallChange = Int(HScrollBar1.LargeChange * 0.1 + 0.99999999999)
HScrollBar1.value = CInt(ChartViewer1.ViewportLeft / (1 - ChartViewer1.ViewportWidth) * _
(HScrollBar1.Max - HScrollBar1.Min)) + HScrollBar1.Min
End If
' Set the horizontal scroll bar to reflect the current view port
VScrollBar1.Enabled = ChartViewer1.ViewportHeight < 1
If VScrollBar1.Enabled Then
VScrollBar1.LargeChange = Int(ChartViewer1.ViewportHeight * _
(VScrollBar1.Max - VScrollBar1.Min) + 0.99999999999)
VScrollBar1.SmallChange = Int(VScrollBar1.LargeChange * 0.1 + 0.99999999999)
VScrollBar1.value = CInt(ChartViewer1.ViewportTop / (1 - ChartViewer1.ViewportHeight) * _
(VScrollBar1.Max - VScrollBar1.Min)) + VScrollBar1.Min
End If
' Update chart and image map if necessary
If needUpdateChart Then
Call drawChart(ChartViewer1)
End If
If needUpdateImageMap Then
Call updateImageMap(ChartViewer1)
End If
End Sub
'
' Draw the chart
'
Sub drawChart(viewer As ChartViewer)
'
' In this demo, we copy the visible part of the data to a separate buffer for chart
' plotting.
'
' Note that if you only have a small amount of data (a few hundred data points), it
' may be easier to just plot all data in any case (so the following copying code is
' not needed), and let ChartDirector "clip" the chart to the plot area.
'
' Using ViewPortLeft and ViewPortWidth, get the start and end dates of the view port.
Dim viewPortStartDate As Date
Dim viewPortEndDate As Date
viewPortStartDate = DateAdd("s", viewer.ViewportLeft * dateRange, minDate)
viewPortEndDate = DateAdd("s", viewer.ViewportWidth * dateRange, viewPortStartDate)
' Get the starting index of the array using the start date
Dim startIndex As Long
startIndex = binarySearch(timeStamps, viewPortStartDate)
If startIndex < 0 Then
startIndex = 0
End If
' Get the ending index of the array using the end date
Dim endIndex As Long
endIndex = binarySearch(timeStamps, viewPortEndDate)
If timeStamps(endIndex) <> viewPortEndDate And endIndex < UBound(timeStamps) Then
endIndex = endIndex + 1
End If
' Get the length
Dim noOfPoints As Long
noOfPoints = endIndex - startIndex + 1
' Now, we can just copy the visible data we need into the view port data series
Dim viewPortTimeStamps()
Dim viewPortDataSeriesA()
Dim viewPortDataSeriesB()
Dim viewPortDataSeriesC()
viewPortTimeStamps = cd.ArrayMath(timeStamps).Trim(startIndex, noOfPoints).result()
viewPortDataSeriesA = cd.ArrayMath(dataSeriesA).Trim(startIndex, noOfPoints).result()
viewPortDataSeriesB = cd.ArrayMath(dataSeriesB).Trim(startIndex, noOfPoints).result()
viewPortDataSeriesC = cd.ArrayMath(dataSeriesC).Trim(startIndex, noOfPoints).result()
If UBound(viewPortTimeStamps) + 1 >= 520 Then
'
' Zoomable chart with high zooming ratios often need to plot many thousands of points when
' fully zoomed out. However, it is usually not needed to plot more data points than the
' pixel resolution of the chart. Plotting too many points may cause the points and the lines
' to overlap on the same pixel. So rather than increasing resolution, this reduces the
' clarity of the chart. It is better to aggregate the data first if there are too many
' points.
'
' In our current example, the chart plot area only has 520 pixels in width and is using a 2
' pixel line width. So if there are more than 520 data points, we aggregate the data using
' the ChartDirector aggregation utility method.
'
' If in your real application, you do not have too many data points, you may remove the
' following code altogether.
'
' Set up an aggregator to aggregate the data based on regular sized slots
Dim m As ArrayMath
Set m = cd.ArrayMath(viewPortTimeStamps)
Call m.selectRegularSpacing((UBound(viewPortTimeStamps) + 1) / 260)
' For the timestamps, take the first timestamp on each slot
viewPortTimeStamps = m.aggregate(viewPortTimeStamps, cd.AggregateFirst)
' For the data values, take the averages
viewPortDataSeriesA = m.aggregate(viewPortDataSeriesA, cd.AggregateAvg)
viewPortDataSeriesB = m.aggregate(viewPortDataSeriesB, cd.AggregateAvg)
viewPortDataSeriesC = m.aggregate(viewPortDataSeriesC, cd.AggregateAvg)
End If
'
' Now we have obtained the data, we can plot the chart.
'
'================================================================================
' Step 1 - Configure overall chart appearance.
'================================================================================
' Create an XYChart object 600 x 300 pixels in size, with pale blue (0xf0f0ff) background, black
' (000000) rounded border, 1 pixel raised effect.
Dim c As XYChart
Set c = cd.XYChart(600, 300, &HF0F0FF, &H0)
Call c.setRoundedFrame
' Set the plotarea at (52, 60) and of size 520 x 192 pixels. Use white (ffffff) background.
' Enable both horizontal and vertical grids by setting their colors to grey (cccccc). Set
' clipping mode to clip the data lines to the plot area.
Call c.setPlotArea(55, 60, 520, 192, &HFFFFFF, -1, -1, &HCCCCCC, &HCCCCCC)
Call c.setClipping
' Add a top title to the chart using 15 pts Times New Roman Bold Italic font, with a light blue
' (ccccff) background, black (000000) border, and a glass like raised effect.
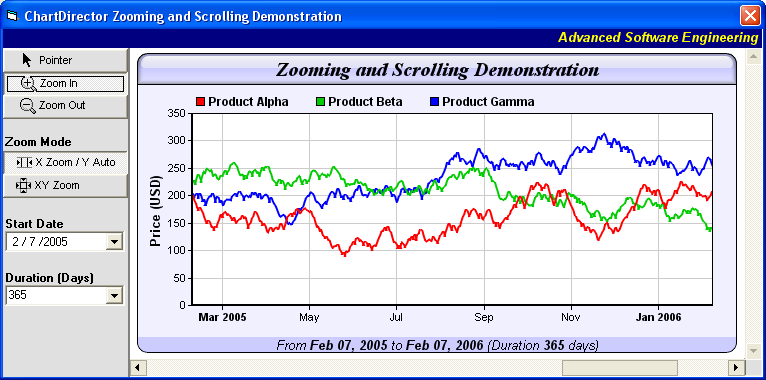
Call c.addTitle("Zooming and Scrolling Demonstration", "timesbi.ttf", 15).setBackground( _
&HCCCCFF, &H0, cd.glassEffect())
' Add a bottom title to the chart to show the date range of the axis, with a light blue (ccccff)
' background.
Call c.addTitle2(cd.Bottom, "From <*font=arialbi.ttf*>" & c.formatValue(viewPortStartDate, _
"{value|mmm dd, yyyy}") & "<*/font*> to <*font=arialbi.ttf*>" & c.formatValue( _
viewPortEndDate, "{value|mmm dd, yyyy}") & "<*/font*> (Duration <*font=arialbi.ttf*>" & _
Int(0.5 + (viewPortEndDate - viewPortStartDate)) & "<*/font*> days)", "ariali.ttf", 10 _
).setBackground(&HCCCCFF)
' Add a legend box at the top of the plot area with 9pts Arial Bold font with flow layout.
Call c.addLegend(50, 33, False, "arialbd.ttf", 9).setBackground(cd.Transparent, cd.Transparent)
' Set axes width to 2 pixels
Call c.xAxis().setWidth(2)
Call c.yAxis().setWidth(2)
' Add a title to the y-axis
Call c.yAxis().setTitle("Price (USD)", "arialbd.ttf", 10)
'================================================================================
' Step 2 - Add data to chart
'================================================================================
'
' In this example, we represent the data by lines. You may modify the code below if you want to
' use other representations (areas, scatter plot, etc).
'
' Add a line layer for the lines, using a line width of 2 pixels
Dim layer As lineLayer
Set layer = c.addLineLayer2()
Call layer.setLineWidth(2)
' Now we add the 3 data series to a line layer, using the color red (ff0000), green (00cc00) and
' blue (0000ff)
Call layer.setXData(viewPortTimeStamps)
Call layer.addDataSet(viewPortDataSeriesA, &HFF0000, "Product Alpha")
Call layer.addDataSet(viewPortDataSeriesB, &HCC00, "Product Beta")
Call layer.addDataSet(viewPortDataSeriesC, &HFF, "Product Gamma")
'================================================================================
' Step 3 - Set up x-axis scale
'================================================================================
' Set x-axis date scale to the view port date range. ChartDirector auto-scaling will
' automatically determine the ticks on the axis.
Call c.xAxis().setDateScale(viewPortStartDate, viewPortEndDate)
'
' In the current demo, the x-axis range can be from a few years to a few days. We can let
' ChartDirector auto-determine the date/time format. However, for more beautiful formatting, we
' set up several label formats to be applied at different conditions.
'
' If all ticks are yearly aligned, then we use "yyyy" as the label format.
Call c.xAxis().setFormatCondition("align", 31104000)
Call c.xAxis().setLabelFormat("{value|yyyy}")
' If all ticks are monthly aligned, then we use "mmm yyyy" in bold font as the first label of a
' year, and "mmm" for other labels.
Call c.xAxis().setFormatCondition("align", 2592000)
Call c.xAxis().setMultiFormat(cd.StartOfYearFilter(), "<*font=bold*>{value|mmm yyyy}", _
cd.AllPassFilter(), "{value|mmm}")
' If all ticks are daily algined, then we use "mmm dd<*br*>yyyy" in bold font as the first label
' of a year, and "mmm dd" in bold font as the first label of a month, and "dd" for other labels.
Call c.xAxis().setFormatCondition("align", 86400)
Call c.xAxis().setMultiFormat(cd.StartOfYearFilter(), _
"<*block,halign=left*><*font=bold*>{value|mmm dd<*br*>yyyy}", cd.StartOfMonthFilter(), _
"<*font=bold*>{value|mmm dd}")
Call c.xAxis().setMultiFormat2(cd.AllPassFilter(), "{value|dd}")
' For all other cases (sub-daily ticks), use "hh:nn<*br*>mmm dd" for the first label of a day,
' and "hh:nn" for other labels.
Call c.xAxis().setFormatCondition("else")
Call c.xAxis().setMultiFormat(cd.StartOfDayFilter(), "<*font=bold*>{value|hh:nn<*br*>mmm dd}", _
cd.AllPassFilter(), "{value|hh:nn}")
'================================================================================
' Step 4 - Set up y-axis scale
'================================================================================
If viewer.ZoomDirection = cvHorizontal Or minValue = maxValue Then
' y-axis is auto-scaled - save the chosen y-axis scaled to support xy-zoom mode
Call c.layout
minValue = c.yAxis().getMinValue()
maxValue = c.yAxis().getMaxValue()
Else
' xy-zoom mode - compute the actual axis scale in the view port
Dim axisLowerLimit As Double
Dim axisUpperLimit As Double
axisLowerLimit = maxValue - (maxValue - minValue) * _
(viewer.ViewportTop + viewer.ViewportHeight)
axisUpperLimit = maxValue - (maxValue - minValue) * viewer.ViewportTop
' *** use the following formula if you are using a log scale axis ***
' axisLowerLimit = maxValue * ((minValue / maxValue) ^ _
' (viewer.ViewPortTop + viewer.ViewPortHeight))
' axisUpperLimit = maxValue * ((minValue / maxValue) ^ viewer.ViewPortTop)
' use the zoomed-in scale
Call c.yAxis().setLinearScale(axisLowerLimit, axisUpperLimit)
Call c.yAxis().setRounding(False, False)
End If
'================================================================================
' Step 5 - Display the chart
'================================================================================
Set viewer.Chart = c
End Sub
'
' Apply image map used on the chart if not already applied
'
Private Sub updateImageMap(viewer As ChartViewer)
If viewer.ImageMap = "" Then
viewer.ImageMap = viewer.Chart.getHTMLImageMap("clickable", "", _
"title='[{dataSetName}] {x|mmm dd, yyyy}: USD {value|2}'")
End If
End Sub
© 2021 Advanced Software Engineering Limited. All rights reserved.