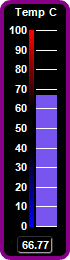
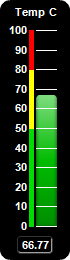
This example demonstrates vertical bar meters in a black coloring scheme, and with bars in various shading styles.
ChartDirector 7.1 (C++ Edition)
Black Vertical Bar Meters
Source Code Listing
#include "chartdir.h"
void createChart(int chartIndex, const char *filename)
{
// The value to display on the meter
double value = 66.77;
// Create a LinearMeter object of size 70 x 260 pixels with black background and rounded corners
LinearMeter* m = new LinearMeter(70, 260, 0x000000);
m->setRoundedFrame(Chart::Transparent);
// Set the default text and line colors to white (0xffffff)
m->setColor(Chart::TextColor, 0xffffff);
m->setColor(Chart::LineColor, 0xffffff);
// Set the scale region top-left corner at (36, 30), with size of 20 x 196 pixels. The scale
// labels are located on the left (default - implies vertical meter).
m->setMeter(36, 30, 20, 196);
// Set meter scale from 0 - 100, with a tick every 10 units
m->setScale(0, 100, 10);
// Add the chart title at the top center
TextBox* title = m->addText(m->getWidth() / 2, 5, "Temp C", "Arial Bold", 8, Chart::TextColor,
Chart::TopCenter);
// Move the scale labels 8 pixels from the meter scale to make room for the color scale
m->setLabelPos(false, 8);
// Demostrate different types of color scales
double smoothColorScale[] = {0, 0x0000ff, 25, 0x0088ff, 50, 0x00ff00, 75, 0xdddd00, 100,
0xff0000};
const int smoothColorScale_size = (int)(sizeof(smoothColorScale)/sizeof(*smoothColorScale));
double stepColorScale[] = {0, 0x00dd00, 50, 0xffff00, 80, 0xff0000, 100};
const int stepColorScale_size = (int)(sizeof(stepColorScale)/sizeof(*stepColorScale));
double highLowColorScale[] = {0, 0x0000ff, 40, Chart::Transparent, 60, Chart::Transparent, 100,
0xff0000};
const int highLowColorScale_size = (int)(sizeof(highLowColorScale)/sizeof(*highLowColorScale));
double highColorScale[] = {70, Chart::Transparent, 100, 0xff0000};
const int highColorScale_size = (int)(sizeof(highColorScale)/sizeof(*highColorScale));
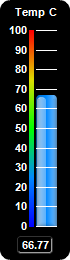
if (chartIndex == 0) {
// Add a blue (0x0088ff) bar from 0 to value with glass effect and 4 pixel rounded corners
m->addBar(0, value, 0x0088ff, Chart::glassEffect(Chart::NormalGlare, Chart::Left), 4);
// Add a 4-pixel thick smooth color scale at x = 29 (left of meter scale)
m->addColorScale(DoubleArray(smoothColorScale, smoothColorScale_size), 29, 4);
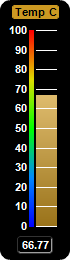
} else if (chartIndex == 1) {
// Add a yellow (0xCC9922) bar from 0 to value with bar lighting effect
m->addBar(0, value, 0xcc9922, Chart::barLighting());
// Add a 4-pixel thick smooth color scale at x = 29 (left of meter scale)
m->addColorScale(DoubleArray(smoothColorScale, smoothColorScale_size), 29, 4);
// Set the title style to black text on a yellow (0xcc9922) background with rounded corners
title->setFontColor(0x000000);
title->setBackground(0xcc9922);
title->setRoundedCorners(2);
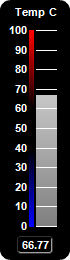
} else if (chartIndex == 2) {
// Add a grey (0xaaaaaa) bar from 0 to value with bar lighting effect
m->addBar(0, value, 0xaaaaaa, Chart::barLighting());
// Add a 4-pixel high/low color scale at x = 29 (left of meter scale)
m->addColorScale(DoubleArray(highLowColorScale, highLowColorScale_size), 29, 4);
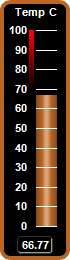
} else if (chartIndex == 3) {
// Add a brown (0xbb6622) bar from 0 to value with cylinder lighting effect
m->addBar(0, value, 0xbb6622, Chart::cylinderEffect());
// Add a 4 pixel thick brown (0xbb6622) frame
m->setThickFrame(4, 0xbb6622);
// Add a high only color scale at x = 29 (left of meter scale)
m->addColorScale(DoubleArray(highColorScale, highColorScale_size), 29, 4);
} else if (chartIndex == 4) {
// Add a purple (0x7755ee) bar from 0 to value
m->addBar(0, value, 0x7755ee);
// Add a 4 pixel thick purple (0x880088) frame
m->setThickFrame(4, 0x880088);
// Add a 4-pixel high/low color scale at x = 29 (left of meter scale)
m->addColorScale(DoubleArray(highLowColorScale, highLowColorScale_size), 29, 4);
} else {
// Add a green (0x00bb00) bar from 0 to value with soft lighting effect and 4 pixel rounded
// corners
m->addBar(0, value, 0x00bb00, Chart::softLighting(), 4);
// Add a 4-pixel step color scale at x = 29 (left of meter scale)
m->addColorScale(DoubleArray(stepColorScale, stepColorScale_size), 29, 4);
}
// Add a text box at the bottom-center. Display the value using white (0xffffff) 8pt Arial Bold
// font on a black (0x000000) background with depressed grey (0x333333) rounded border.
TextBox* t = m->addText(m->getWidth() / 2, m->getHeight() - 7, m->formatValue(value, "2"),
"Arial Bold", 8, 0xffffff, Chart::BottomCenter);
t->setBackground(0x000000, 0x333333, -1);
t->setRoundedCorners(3);
// Output the chart
m->makeChart(filename);
//free up resources
delete m;
}
int main(int argc, char *argv[])
{
createChart(0, "blackvbarmeter0.png");
createChart(1, "blackvbarmeter1.png");
createChart(2, "blackvbarmeter2.png");
createChart(3, "blackvbarmeter3.png");
createChart(4, "blackvbarmeter4.png");
createChart(5, "blackvbarmeter5.png");
return 0;
}