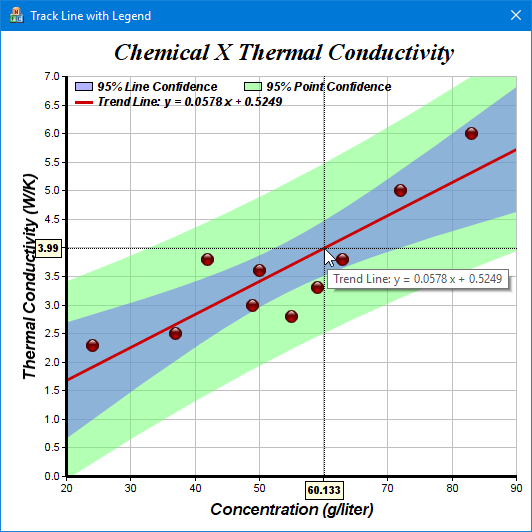
This sample program demonstrates a track cursor programmed as a crosshair cursor with axis labels.
The code first draws the chart. Then in the
CVN_MouseMovePlotArea message handler, the track cursor is drawn to reflect the mouse position. The track cursor is configured to automatically hide itself when the mouse leaves the plot area.
The
crossHair method is the routine that draws the track cursor. Its key elements are:
[MFC version] mfcdemo/CrossHairDlg.cpp
// CrossHairDlg.cpp : implementation file
//

#include "stdafx.h"
#include "resource.h"
#include "crosshairDlg.h"
#include "chartdir.h"
#include <sstream>

using namespace std;

#ifdef _DEBUG
#define new DEBUG_NEW
#endif

//
// Constructor
//
CCrossHairDlg::CCrossHairDlg(CWnd* pParent /*=NULL*/)
    : CDialogEx(IDD_TRACKCURSOR_DEMO, pParent)
{
    SetBackgroundColor(RGB(255, 255, 255));
}

//
// Destructor
//
CCrossHairDlg::~CCrossHairDlg()
{
    delete m_ChartViewer.getChart();
}

void CCrossHairDlg::DoDataExchange(CDataExchange* pDX)
{
    CDialogEx::DoDataExchange(pDX);
    DDX_Control(pDX, IDC_ChartViewer, m_ChartViewer);
}

BEGIN_MESSAGE_MAP(CCrossHairDlg, CDialogEx)
    ON_CONTROL(CVN_MouseMovePlotArea, IDC_ChartViewer, OnMouseMovePlotArea)
END_MESSAGE_MAP()


//
// Initialization
//
BOOL CCrossHairDlg::OnInitDialog()
{
    CDialogEx::OnInitDialog();

    SetWindowText(_T("Crosshair with Axis Labels"));

    // Draw the chart
    drawChart(&m_ChartViewer);

     // Resize the window to fit the chart size
    CRect winSize;
    m_ChartViewer.GetWindowRect(winSize);
    m_ChartViewer.MoveWindow(5, 5, winSize.Width(), winSize.Height());
    CalcWindowRect(&winSize, CWnd::adjustBorder);
    SetWindowPos(&wndTop, 0, 0, winSize.Width() + 10, winSize.Height() + 10, SWP_NOMOVE);

    return TRUE;
}

//
// Draw track cursor when mouse is moving over plotarea
//
void CCrossHairDlg::OnMouseMovePlotArea()
{
    // Draw crosshair track cursor
    crosshair((XYChart *)m_ChartViewer.getChart(), m_ChartViewer.getPlotAreaMouseX(),
        m_ChartViewer.getPlotAreaMouseY());
    m_ChartViewer.updateDisplay();

    // Hide the track cursor when the mouse leaves the plot area
    m_ChartViewer.removeDynamicLayer(CVN_MouseLeavePlotArea);
}

//
// Draw the chart and display it in the given viewer
//
void CCrossHairDlg::drawChart(CChartViewer *viewer)
{
    // The XY data of the first data series
    double dataX[] = {50, 55, 37, 24, 42, 49, 63, 72, 83, 59};
    double dataY[] = {3.6, 2.8, 2.5, 2.3, 3.8, 3.0, 3.8, 5.0, 6.0, 3.3};
    int noOfPoints = (int)(sizeof(dataX) / sizeof(*dataX));

    // Create a XYChart object of size 520 x 490 pixels
    XYChart *c = new XYChart(520, 490);

    // Set the plotarea at (60, 40) and of size 450 x 400 pixels, with white background and a light
    // grey border (0xc0c0c0). Turn on both horizontal and vertical grid lines with light grey color
    // (0xc0c0c0)
    c->setPlotArea(60, 40, 450, 400, 0xffffff, -1, 0xc0c0c0, 0xc0c0c0, -1);

    // Add a title to the chart using 18 point Times Bold Itatic font.
    c->addTitle("      Chemical X Thermal Conductivity", "Times New Roman Bold Italic", 18);

    // Add titles to the axes using 12 pts Arial Bold Italic font
    c->yAxis()->setTitle("Thermal Conductivity (W/K)", "Arial Bold Italic", 12);
    c->xAxis()->setTitle("Concentration (g/liter)", "Arial Bold Italic", 12);

    // Set the axes line width to 3 pixels
    c->yAxis()->setWidth(3);
    c->xAxis()->setWidth(3);

    // Add a scatter layer using (dataX, dataY)
    ScatterLayer *scatterLayer = c->addScatterLayer(DoubleArray(dataX, noOfPoints),
        DoubleArray(dataY, noOfPoints), "", Chart::GlassSphereShape, 13, 0xcc0000);

    // Tooltip for the scatter layer
    scatterLayer->setHTMLImageMap("", "",
        "title='<*cdml*>Concentration: {x} g/liter<*br*>Conductivity: {value} W/K'");

    // Add a trend line layer for (dataX, dataY)
    TrendLayer *trendLayer = c->addTrendLayer(DoubleArray(dataX, noOfPoints),
        DoubleArray(dataY, noOfPoints), 0xcc0000);

    // Set the line width to 3 pixels
    trendLayer->setLineWidth(3);

    // Add a 95% confidence band for the line
    trendLayer->addConfidenceBand(0.95, 0x806666ff);

    // Add a 95% confidence band (prediction band) for the points
    trendLayer->addPredictionBand(0.95, 0x8066ff66);

    // Tool tip for the trend layer
    trendLayer->setHTMLImageMap("", "",
        "title='<*cdml*>Trend Line: y = {slope|P4} x + {intercept|P4}'");

    // Add a legend box at (60, 35) (top of the chart) with horizontal layout. Use 10 pts Arial Bold
    // Italic font. Set the background and border color to Transparent and use line style legend
    // icons.
    LegendBox *legendBox = c->addLegend(60, 35, false, "Arial Bold Italic", 9);
    legendBox->setBackground(Chart::Transparent);
    legendBox->setLineStyleKey(true);

    // Add entries to the legend box
    legendBox->addKey("95% Line Confidence", 0x806666ff);
    legendBox->addKey("95% Point Confidence", 0x8066ff66);

    ostringstream trendLegend;
    trendLegend << "Trend Line: y = " << c->formatValue(trendLayer->getSlope(), "{value|4}") << " x";
    trendLegend << " + " << c->formatValue(trendLayer->getIntercept(), "{value|4}");
    legendBox->addKey(trendLegend.str().c_str(), 0xcc0000, 3);

    // Assign the chart to the WinChartViewer
    viewer->setChart(c);

    // Include tool tip for the chart
    viewer->setImageMap(c->getHTMLImageMap(""));
}

//
// Draw cross hair cursor with axis labels
//
void CCrossHairDlg::crosshair(XYChart *c, int mouseX, int mouseY)
{
    // Clear the current dynamic layer and get the DrawArea object to draw on it.
    DrawArea *d = c->initDynamicLayer();

    // The plot area object
    PlotArea *plotArea = c->getPlotArea();

    // Draw a vertical line and a horizontal line as the cross hair
    d->vline(plotArea->getTopY(), plotArea->getBottomY(), mouseX, d->dashLineColor(0x000000, 0x0101));
    d->hline(plotArea->getLeftX(), plotArea->getRightX(), mouseY, d->dashLineColor(0x000000, 0x0101));

    // Draw y-axis label
    ostringstream ylabel;
    ylabel << "<*block,bgColor=FFFFDD,margin=3,edgeColor=000000*>" << c->formatValue(c->getYValue(
        mouseY, c->yAxis()), "{value|P4}") << "<*/*>";
    TTFText *t = d->text(ylabel.str().c_str(), "Arial Bold", 8);
    t->draw(plotArea->getLeftX() - 5, mouseY, 0x000000, Chart::Right);
    t->destroy();

    // Draw x-axis label
    ostringstream xlabel;
    xlabel << "<*block,bgColor=FFFFDD,margin=3,edgeColor=000000*>" << c->formatValue(c->getXValue(
        mouseX), "{value|P4}") << "<*/*>";
    t = d->text(xlabel.str().c_str(), "Arial Bold", 8);
    t->draw(mouseX, plotArea->getBottomY() + 5, 0x000000, Chart::Top);
    t->destroy();
}
© 2023 Advanced Software Engineering Limited. All rights reserved.