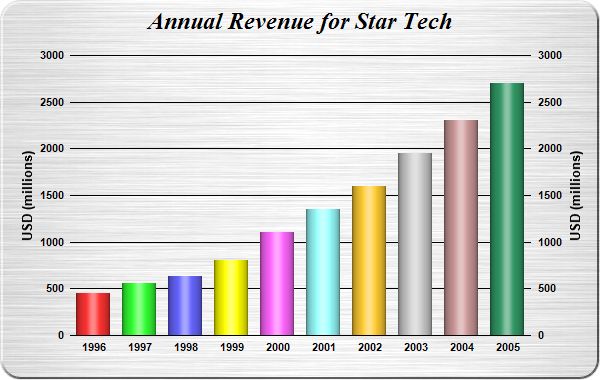
This example demonstrates using cylinder shading effect for bars. It also demonstrates brushed metal background, rounded frame, and axis labels on both sides of the plot area.
The following is the command line version of the code in "cppdemo/cylinderlightbar". The MFC version of the code is in "mfcdemo/mfcdemo". The Qt Widgets version of the code is in "qtdemo/qtdemo". The QML/Qt Quick version of the code is in "qmldemo/qmldemo".
#include "chartdir.h"

int main(int argc, char *argv[])
{
    // The data for the bar chart
    double data[] = {450, 560, 630, 800, 1100, 1350, 1600, 1950, 2300, 2700};
    const int data_size = (int)(sizeof(data)/sizeof(*data));

    // The labels for the bar chart
    const char* labels[] = {"1996", "1997", "1998", "1999", "2000", "2001", "2002", "2003", "2004",
        "2005"};
    const int labels_size = (int)(sizeof(labels)/sizeof(*labels));

    // Create a XYChart object of size 600 x 380 pixels. Set background color to brushed silver,
    // with a 2 pixel 3D border. Use rounded corners of 20 pixels radius.
    XYChart* c = new XYChart(600, 380, Chart::brushedSilverColor(), Chart::Transparent, 2);

    // Add a title to the chart using 18pt Times Bold Italic font. Set top/bottom margins to 8
    // pixels.
    c->addTitle("Annual Revenue for Star Tech", "Times New Roman Bold Italic", 18)->setMargin(0, 0,
        8, 8);

    // Set the plotarea at (70, 55) and of size 460 x 280 pixels. Use transparent border and black
    // grid lines. Use rounded frame with radius of 20 pixels.
    c->setPlotArea(70, 55, 460, 280, -1, -1, Chart::Transparent, 0x000000);
    c->setRoundedFrame(0xffffff, 20);

    // Add a multi-color bar chart layer using the supplied data. Set cylinder bar shape.
    c->addBarLayer(DoubleArray(data, data_size), IntArray(0, 0))->setBarShape(Chart::CircleShape);

    // Set the labels on the x axis.
    c->xAxis()->setLabels(StringArray(labels, labels_size));

    // Show the same scale on the left and right y-axes
    c->syncYAxis();

    // Set the left y-axis and right y-axis title using 10pt Arial Bold font
    c->yAxis()->setTitle("USD (millions)", "Arial Bold", 10);
    c->yAxis2()->setTitle("USD (millions)", "Arial Bold", 10);

    // Set y-axes to transparent
    c->yAxis()->setColors(Chart::Transparent);
    c->yAxis2()->setColors(Chart::Transparent);

    // Disable ticks on the x-axis by setting the tick color to transparent
    c->xAxis()->setTickColor(Chart::Transparent);

    // Set the label styles of all axes to 8pt Arial Bold font
    c->xAxis()->setLabelStyle("Arial Bold", 8);
    c->yAxis()->setLabelStyle("Arial Bold", 8);
    c->yAxis2()->setLabelStyle("Arial Bold", 8);

    // Output the chart
    c->makeChart("cylinderlightbar.jpg");

    //free up resources
    delete c;

    return 0;
}
© 2023 Advanced Software Engineering Limited. All rights reserved.