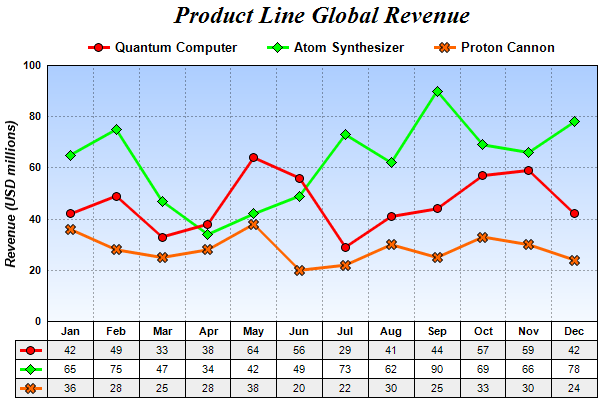
This example demonstrates putting a data table under the x-axis.
In ChartDirector, the labels in a label based x-axis (that is, axis configured with
Axis.setLabels or
Axis.setLabels2) can be converted to a table using
Axis.makeLabelTable.
Note: Axis.makeLabelTable is only supported on a label based axis with no label stepping. You should not use this method with other axis configuration.
The
Axis.makeLabelTable returns a
CDMLTable object representing the table. It can be used to add more content to the table and to configure the appearance of the table.
In this example, 3 rows with alternating background colors are added to the table using
CDMLTable.appendRow. The cells in the rows are filled with data values using
CDMLTable.setText. A column is added to the left of the table using
CDMLTable.insertCol, and filled with the legend icons obtained using
Layer.getLegendIcon.
The following is the command line version of the code in "cppdemo/datatable". The MFC version of the code is in "mfcdemo/mfcdemo". The Qt Widgets version of the code is in "qtdemo/qtdemo". The QML/Qt Quick version of the code is in "qmldemo/qmldemo".
#include "chartdir.h"
#include <stdio.h>

int main(int argc, char *argv[])
{
    char buffer[1024];

    // The data for the line chart
    double data0[] = {42, 49, 33, 38, 64, 56, 29, 41, 44, 57, 59, 42};
    const int data0_size = (int)(sizeof(data0)/sizeof(*data0));
    double data1[] = {65, 75, 47, 34, 42, 49, 73, 62, 90, 69, 66, 78};
    const int data1_size = (int)(sizeof(data1)/sizeof(*data1));
    double data2[] = {36, 28, 25, 28, 38, 20, 22, 30, 25, 33, 30, 24};
    const int data2_size = (int)(sizeof(data2)/sizeof(*data2));
    const char* labels[] = {"Jan", "Feb", "Mar", "Apr", "May", "Jun", "Jul", "Aug", "Sep", "Oct",
        "Nov", "Dec"};
    const int labels_size = (int)(sizeof(labels)/sizeof(*labels));

    // Create a XYChart object of size 600 x 400 pixels
    XYChart* c = new XYChart(600, 400);

    // Add a title to the chart using 18pt Times Bold Italic font
    TextBox* title = c->addTitle("Product Line Global Revenue", "Times New Roman Bold Italic", 18);

    // Tentatively set the plotarea at (50, 55) and of (chart_width - 100) x (chart_height - 120)
    // pixels in size. Use a vertical gradient color from sky blue (aaccff) t0 light blue (f9f9ff)
    // as background. Set both horizontal and vertical grid lines to dotted semi-transprent black
    // (aa000000).
    PlotArea* plotArea = c->setPlotArea(50, 55, c->getWidth() - 100, c->getHeight() - 120,
        c->linearGradientColor(0, 55, 0, 55 + c->getHeight() - 120, 0xaaccff, 0xf9fcff), -1, -1,
        c->dashLineColor(0xaa000000, Chart::DotLine), -1);

    // Add a legend box and anchored the top center at the horizontal center of the chart, just
    // under the title. Use 10pt Arial Bold as font, with transparent background and border.
    LegendBox* legendBox = c->addLegend(c->getWidth() / 2, title->getHeight(), false, "Arial Bold",
        10);
    legendBox->setAlignment(Chart::TopCenter);
    legendBox->setBackground(Chart::Transparent, Chart::Transparent);

    // Set y-axis title using 10 points Arial Bold Italic font, label style to 8 points Arial Bold,
    // and axis color to transparent
    c->yAxis()->setTitle("Revenue (USD millions)", "Arial Bold Italic", 10);
    c->yAxis()->setLabelStyle("Arial Bold", 8);
    c->yAxis()->setColors(Chart::Transparent);

    // Set y-axis tick density to 30 pixels. ChartDirector auto-scaling will use this as the
    // guideline when putting ticks on the y-axis.
    c->yAxis()->setTickDensity(30);

    // Add a line layer to the chart
    LineLayer* layer = c->addLineLayer();

    // Set the line width to 3 pixels
    layer->setLineWidth(3);

    // Add the three data sets to the line layer, using circles, diamands and X shapes as symbols
    layer->addDataSet(DoubleArray(data0, data0_size), 0xff0000, "Quantum Computer")->setDataSymbol(
        Chart::CircleSymbol, 9);
    layer->addDataSet(DoubleArray(data1, data1_size), 0x00ff00, "Atom Synthesizer")->setDataSymbol(
        Chart::DiamondSymbol, 11);
    layer->addDataSet(DoubleArray(data2, data2_size), 0xff6600, "Proton Cannon")->setDataSymbol(
        Chart::Cross2Shape(), 11);

    // Set the x axis labels
    c->xAxis()->setLabels(StringArray(labels, labels_size));

    // Convert the labels on the x-axis to a CDMLTable
    CDMLTable* table = c->xAxis()->makeLabelTable();

    // Set the default top/bottom margins of the cells to 3 pixels
    table->getStyle()->setMargin(0, 0, 3, 3);

    // Use Arial Bold as the font for the first row
    table->getRowStyle(0)->setFontStyle("Arial Bold");

    //
    // We can add more information to the table. In this sample code, we add the data series and the
    // legend icons to the table.
    //

    // Add 3 more rows to the table. Set the background of the 1st and 3rd rows to light grey
    // (eeeeee).
    table->appendRow()->setBackground(0xeeeeee, Chart::LineColor);
    table->appendRow();
    table->appendRow()->setBackground(0xeeeeee, Chart::LineColor);

    // Put the values of the 3 data series to the cells in the 3 rows
    for(int i = 0; i < data0_size; ++i) {
        sprintf(buffer, "%g", data0[i]);
        table->setText(i, 1, buffer);
        sprintf(buffer, "%g", data1[i]);
        table->setText(i, 2, buffer);
        sprintf(buffer, "%g", data2[i]);
        table->setText(i, 3, buffer);
    }

    // Insert a column on the left for the legend icons. Use 5 pixels left/right margins and 3
    // pixels top/bottom margins for the cells in this column.
    table->insertCol(0)->setMargin(5, 5, 3, 3);

    // The top cell is set to transparent, so it is invisible
    table->getCell(0, 0)->setBackground(Chart::Transparent, Chart::Transparent);

    // The other 3 cells are set to the legend icons of the 3 data series
    table->setText(0, 1, layer->getLegendIcon(0));
    table->setText(0, 2, layer->getLegendIcon(1));
    table->setText(0, 3, layer->getLegendIcon(2));

    // Layout legend box first, so we can get its size
    c->layoutLegend();

    // Adjust the plot area size, such that the bounding box (inclusive of axes) is 2 pixels from
    // the left, right and bottom edge, and is just under the legend box.
    c->packPlotArea(2, legendBox->getTopY() + legendBox->getHeight(), c->getWidth() - 3,
        c->getHeight() - 3);

    // After determining the exact plot area position, we may adjust the legend box and the title
    // positions so that they are centered relative to the plot area (instead of the chart)
    legendBox->setPos(plotArea->getLeftX() + (plotArea->getWidth() - legendBox->getWidth()) / 2,
        legendBox->getTopY());
    title->setPos(plotArea->getLeftX() + (plotArea->getWidth() - title->getWidth()) / 2,
        title->getTopY());

    // Output the chart
    c->makeChart("datatable.png");

    //free up resources
    delete c;

    return 0;
}
© 2023 Advanced Software Engineering Limited. All rights reserved.