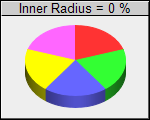
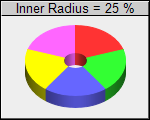
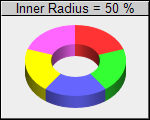
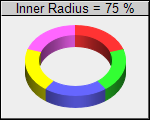
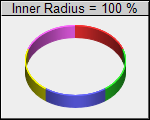
This example demonstrates the effects of different donut widths.
Donut widths are configured by using different inner and outer radii when calling PieChart.setDonutSize.
ChartDirector 7.1 (C++ Edition)
Donut Width
Source Code Listing
#include "chartdir.h"
#include <stdio.h>

void createChart(int chartIndex, const char *filename)
{
    char buffer[1024];

    // Determine the donut inner radius (as percentage of outer radius) based on input parameter
    int donutRadius = chartIndex * 25;

    // The data for the pie chart
    double data[] = {10, 10, 10, 10, 10};
    const int data_size = (int)(sizeof(data)/sizeof(*data));

    // The labels for the pie chart
    const char* labels[] = {"Marble", "Wood", "Granite", "Plastic", "Metal"};
    const int labels_size = (int)(sizeof(labels)/sizeof(*labels));

    // Create a PieChart object of size 150 x 120 pixels, with a grey (EEEEEE) background, black
    // border and 1 pixel 3D border effect
    PieChart* c = new PieChart(150, 120, 0xeeeeee, 0x000000, 1);

    // Set donut center at (75, 65) and the outer radius to 50 pixels. Inner radius is computed
    // according donutWidth
    c->setDonutSize(75, 60, 50, 50 * donutRadius / 100);

    // Add a title to show the donut width
    sprintf(buffer, "Inner Radius = %d %%", donutRadius);
    c->addTitle(buffer, "Arial", 10)->setBackground(0xcccccc, 0);

    // Draw the pie in 3D
    c->set3D(12);

    // Set the pie data and the pie labels
    c->setData(DoubleArray(data, data_size), StringArray(labels, labels_size));

    // Disable the sector labels by setting the color to Transparent
    c->setLabelStyle("", 8, Chart::Transparent);

    // Output the chart
    c->makeChart(filename);

    //free up resources
    delete c;

}

int main(int argc, char *argv[])
{
    createChart(0, "donutwidth0.png");
    createChart(1, "donutwidth1.png");
    createChart(2, "donutwidth2.png");
    createChart(3, "donutwidth3.png");
    createChart(4, "donutwidth4.png");
    return 0;
}