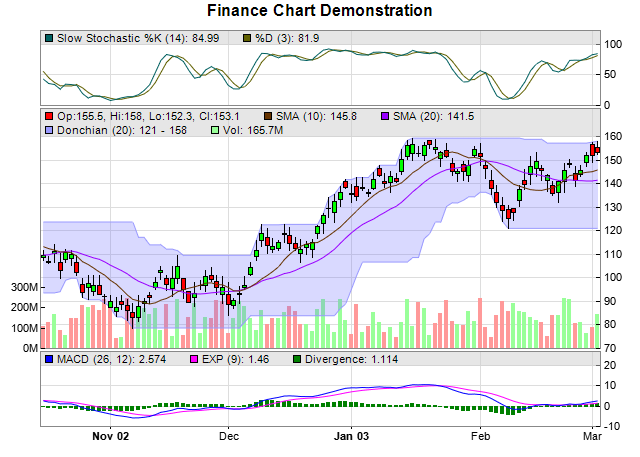
This example demonstrate creating a full-featured finance chart, with candlesticks, moving averages, Donchian channel, volume bars, MACD and Stochastic indicators.
This example employs the
FinanceChart library add-on to allow complex financial charts to be composed easily. In this example, the key steps are:
For simplicity and to allow this example to run without connecting to a real database, a
RanTable object is used to simulate the data.
RanTable is a ChartDirector utility class used for creating tables with random numbers.
The following is the command line version of the code in "cppdemo/finance2". The MFC version of the code is in "mfcdemo/mfcdemo". The Qt Widgets version of the code is in "qtdemo/qtdemo". The QML/Qt Quick version of the code is in "qmldemo/qmldemo".
#include "FinanceChart.h"

int main(int argc, char *argv[])
{
    // Create a finance chart demo containing 100 days of data
    int noOfDays = 100;

    // To compute moving averages starting from the first day, we need to get extra data points
    // before the first day
    int extraDays = 30;

    // In this exammple, we use a random number generator utility to simulate the data. We set up
    // the random table to create 6 cols x (noOfDays + extraDays) rows, using 9 as the seed.
    RanTable* rantable = new RanTable(9, 6, noOfDays + extraDays);

    // Set the 1st col to be the timeStamp, starting from Sep 4, 2002, with each row representing
    // one day, and counting week days only (jump over Sat and Sun)
    rantable->setDateCol(0, Chart::chartTime(2002, 9, 4), 86400, true);

    // Set the 2nd, 3rd, 4th and 5th columns to be high, low, open and close data. The open value
    // starts from 100, and the daily change is random from -5 to 5.
    rantable->setHLOCCols(1, 100, -5, 5);

    // Set the 6th column as the vol data from 5 to 25 million
    rantable->setCol(5, 50000000, 250000000);

    // Now we read the data from the table into arrays
    DoubleArray timeStamps = rantable->getCol(0);
    DoubleArray highData = rantable->getCol(1);
    DoubleArray lowData = rantable->getCol(2);
    DoubleArray openData = rantable->getCol(3);
    DoubleArray closeData = rantable->getCol(4);
    DoubleArray volData = rantable->getCol(5);

    // Create a FinanceChart object of width 640 pixels
    FinanceChart* c = new FinanceChart(640);

    // Add a title to the chart
    c->addTitle("Finance Chart Demonstration");

    // Set the data into the finance chart object
    c->setData(timeStamps, highData, lowData, openData, closeData, volData, extraDays);

    // Add a slow stochastic chart (75 pixels high) with %K = 14 and %D = 3
    c->addSlowStochastic(75, 14, 3, 0x006060, 0x606000);

    // Add the main chart with 240 pixels in height
    c->addMainChart(240);

    // Add a 10 period simple moving average to the main chart, using brown color
    c->addSimpleMovingAvg(10, 0x663300);

    // Add a 20 period simple moving average to the main chart, using purple color
    c->addSimpleMovingAvg(20, 0x9900ff);

    // Add candlestick symbols to the main chart, using green/red for up/down days
    c->addCandleStick(0x00ff00, 0xff0000);

    // Add 20 days donchian channel to the main chart, using light blue (9999ff) as the border and
    // semi-transparent blue (c06666ff) as the fill color
    c->addDonchianChannel(20, 0x9999ff, 0xc06666ff);

    // Add a 75 pixels volume bars sub-chart to the bottom of the main chart, using green/red/grey
    // for up/down/flat days
    c->addVolBars(75, 0x99ff99, 0xff9999, 0x808080);

    // Append a MACD(26, 12) indicator chart (75 pixels high) after the main chart, using 9 days for
    // computing divergence.
    c->addMACD(75, 26, 12, 9, 0x0000ff, 0xff00ff, 0x008000);

    // Output the chart
    c->makeChart("finance2.png");

    //free up resources
    delete rantable;
    delete c;

    return 0;
}
© 2023 Advanced Software Engineering Limited. All rights reserved.