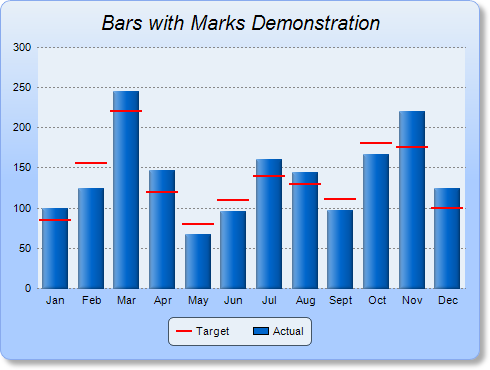
This example demonstrates combine a bar layer with a box-whisker layer to create bars with marks. It also demonstrates gradient background color, rounded frame, soft drop shadow, and automatic resizing of the plot area to fit the chart.
The following is the command line version of the code in "cppdemo/markbar". The MFC version of the code is in "mfcdemo/mfcdemo". The Qt Widgets version of the code is in "qtdemo/qtdemo". The QML/Qt Quick version of the code is in "qmldemo/qmldemo".
#include "chartdir.h"

int main(int argc, char *argv[])
{
    // The data for the bars and the marks
    double barData[] = {100, 125, 245, 147, 67, 96, 160, 145, 97, 167, 220, 125};
    const int barData_size = (int)(sizeof(barData)/sizeof(*barData));
    double markData[] = {85, 156, 220, 120, 80, 110, 140, 130, 111, 180, 175, 100};
    const int markData_size = (int)(sizeof(markData)/sizeof(*markData));

    // The labels for the bar chart
    const char* labels[] = {"Jan", "Feb", "Mar", "Apr", "May", "Jun", "Jul", "Aug", "Sept", "Oct",
        "Nov", "Dec"};
    const int labels_size = (int)(sizeof(labels)/sizeof(*labels));

    // Create a XYChart object of size 480 x 360 pixels. Use a vertical gradient color from pale
    // blue (e8f0f8) to sky blue (aaccff) spanning half the chart height as background. Set border
    // to blue (88aaee). Use rounded corners. Enable soft drop shadow.
    XYChart* c = new XYChart(480, 360);
    c->setBackground(c->linearGradientColor(0, 0, 0, c->getHeight() / 2, 0xe8f0f8, 0xaaccff),
        0x88aaee);
    c->setRoundedFrame();
    c->setDropShadow();

    // Add a title to the chart using 15 points Arial Italic font. Set top/bottom margins to 12
    // pixels.
    TextBox* title = c->addTitle("Bars with Marks Demonstration", "Arial Italic", 15);
    title->setMargin(0, 0, 12, 12);

    // Tentatively set the plotarea to 50 pixels from the left edge to allow for the y-axis, and to
    // just under the title. Set the width to 65 pixels less than the chart width, and the height to
    // reserve 90 pixels at the bottom for the x-axis and the legend box. Use pale blue (e8f0f8)
    // background, transparent border, and grey (888888) dotted horizontal grid lines.
    c->setPlotArea(50, title->getHeight(), c->getWidth() - 65, c->getHeight() - title->getHeight() -
        90, 0xe8f0f8, -1, Chart::Transparent, c->dashLineColor(0x888888, Chart::DotLine));

    // Add a legend box where the bottom-center is anchored to the 15 pixels above the bottom-center
    // of the chart. Use horizontal layout and 8 points Arial font.
    LegendBox* legendBox = c->addLegend(c->getWidth() / 2, c->getHeight() - 15, false, "Arial", 8);
    legendBox->setAlignment(Chart::BottomCenter);

    // Set the legend box background and border to pale blue (e8f0f8) and bluish grey (445566)
    legendBox->setBackground(0xe8f0f8, 0x445566);

    // Use rounded corners of 5 pixel radius for the legend box
    legendBox->setRoundedCorners(5);

    // Use line style legend key
    legendBox->setLineStyleKey();

    // Set axes to transparent
    c->xAxis()->setColors(Chart::Transparent);
    c->yAxis()->setColors(Chart::Transparent);

    // Set the labels on the x axis
    c->xAxis()->setLabels(StringArray(labels, labels_size));

    // Add a box-whisker layer with just the middle mark visible for the marks. Use red (ff0000)
    // color for the mark, with a line width of 2 pixels and 10% horizontal gap
    BoxWhiskerLayer* markLayer = c->addBoxWhiskerLayer(DoubleArray(), DoubleArray(), DoubleArray(),
        DoubleArray(), DoubleArray(markData, markData_size), -1, 0xff0000);
    markLayer->setLineWidth(2);
    markLayer->setDataGap(0.1);

    // Add the legend key for the mark line
    legendBox->addKey("Target", 0xff0000, 2);

    // Add a blue (0066cc) bar layer using the given data.
    BarLayer* barLayer = c->addBarLayer(DoubleArray(barData, barData_size), 0x0066cc, "Actual");

    // Use soft lighting effect for the bars with light direction from left.
    barLayer->setBorderColor(Chart::Transparent, Chart::softLighting(Chart::Left));

    // Adjust the plot area size, such that the bounding box (inclusive of axes) is 10 pixels from
    // the left edge, just below the title, 15 pixels from the right edge, and 10 pixels above the
    // legend box.
    c->packPlotArea(10, title->getHeight(), c->getWidth() - 15, c->layoutLegend()->getTopY() - 10);

    // Output the chart
    c->makeChart("markbar.png");

    //free up resources
    delete c;

    return 0;
}
© 2023 Advanced Software Engineering Limited. All rights reserved.