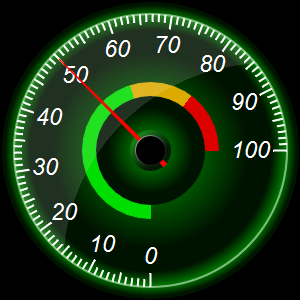
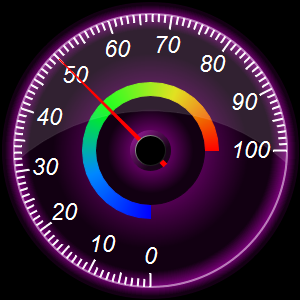
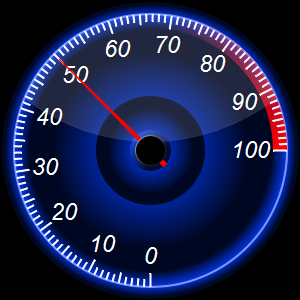
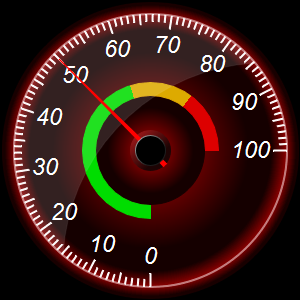
This examples demonstrates various shading effects to create round meters with a neon look and feel. It also demonstrates how to create meters that can easily be resized.
In this example, the code uses a single size parameter as input, and it derives all the other sizes, such as the radius of the various parts of the chart, the font size, line widths and tick lengths. This allows the chart to be easily resized by changing only one parameter.
For the colors, apart from black and white, the code only uses a single color as input.
BaseChart.adjustBrightness is used to create brighter or darker versions of that color, and
AngularMeter.relativeRadialGradient is used to combine them in gradients.
The following is the command line version of the code in "cppdemo/neonroundmeter". The MFC version of the code is in "mfcdemo/mfcdemo". The Qt Widgets version of the code is in "qtdemo/qtdemo". The QML/Qt Quick version of the code is in "qmldemo/qmldemo".
#include "chartdir.h"

void createChart(int chartIndex, const char *filename)
{
    // The value to display on the meter
    double value = 50;

    // The main color of the four meters in this example. The other colors and gradients are derived
    // from the main color.
    int colorList[] = {0x007700, 0x770077, 0x0033dd, 0x880000};
    const int colorList_size = (int)(sizeof(colorList)/sizeof(*colorList));
    int mainColor = colorList[chartIndex];

    //
    // In this example, we demonstrate how to parameterized by size, so that the chart size can be
    // changed by changing just one variable.
    //
    int size = 300;

    // The radius of the entire meter, which is size / 2, minus 2 pixels for margin
    int outerRadius = size / 2 - 2;

    // The radius of the meter scale
    int scaleRadius = outerRadius * 92 / 100;

    // The radius of the inner decorative circle
    int innerRadius = scaleRadius * 40 / 100;

    // The width of the color scale
    int colorScaleWidth = scaleRadius * 10 / 100;

    // Major tick length
    int tickLength = scaleRadius * 10 / 100;

    // Major tick width
    int tickWidth = scaleRadius * 1 / 100 + 1;

    // Label font size
    int fontSize = scaleRadius * 13 / 100;

    //
    // Create an angular meter based on the above parameters
    //

    // Create an AngularMeter object of the specified size. In this demo, we use black (0x000000) as
    // the background color. You can also use transparent or other colors.
    AngularMeter* m = new AngularMeter(size, size, 0x000000);

    // Set the default text and line colors to white (0xffffff)
    m->setColor(Chart::TextColor, 0xffffff);
    m->setColor(Chart::LineColor, 0xffffff);

    // Set meter center and scale radius, and set the scale angle from -180 to +90 degrees
    m->setMeter(size / 2, size / 2, scaleRadius, -180, 90);

    // Background gradient with the mainColor at the center and become darker near the border
    double bgGradient[] = {0, (double)(mainColor), 0.5, (double)(m->adjustBrightness(mainColor, 0.75
        )), 1, (double)(m->adjustBrightness(mainColor, 0.15))};
    const int bgGradient_size = (int)(sizeof(bgGradient)/sizeof(*bgGradient));

    // Fill the meter background with the background gradient
    m->addRing(0, outerRadius, m->relativeRadialGradient(DoubleArray(bgGradient, bgGradient_size),
        outerRadius * 0.66));

    // Fill the inner circle with the same background gradient for decoration
    m->addRing(0, innerRadius, m->relativeRadialGradient(DoubleArray(bgGradient, bgGradient_size),
        innerRadius * 0.8));

    // Gradient for the neon backlight, with the main color at the scale radius fading to
    // transparent
    double neonGradient[] = {0.89, Chart::Transparent, 1, (double)(mainColor), 1.07,
        Chart::Transparent};
    const int neonGradient_size = (int)(sizeof(neonGradient)/sizeof(*neonGradient));
    m->addRing(scaleRadius * 85 / 100, outerRadius, m->relativeRadialGradient(DoubleArray(
        neonGradient, neonGradient_size)));

    // The neon ring at the scale radius with width equal to 1/80 of the scale radius, creating
    // using a brighter version of the main color
    m->addRing(scaleRadius, scaleRadius + scaleRadius / 80, m->adjustBrightness(mainColor, 2));

    // Meter scale is 0 - 100, with major/minor/micro ticks every 10/5/1 units
    m->setScale(0, 100, 10, 5, 1);

    // Set the scale label style, tick length and tick width. The minor and micro tick lengths are
    // 80% and 60% of the major tick length, and their widths are around half of the major tick
    // width.
    m->setLabelStyle("Arial Italic", fontSize);
    m->setTickLength(-tickLength, -(tickLength * 80 / 100), -(tickLength * 60 / 100));
    m->setLineWidth(0, tickWidth, (tickWidth + 1) / 2, (tickWidth + 1) / 2);

    // Demostrate different types of color scales and glare effects and putting them at different
    // positions.
    double smoothColorScale[] = {0, 0x0000ff, 25, 0x0088ff, 50, 0x00ff00, 75, 0xdddd00, 100,
        0xff0000};
    const int smoothColorScale_size = (int)(sizeof(smoothColorScale)/sizeof(*smoothColorScale));
    double stepColorScale[] = {0, 0x00dd00, 60, 0xddaa00, 80, 0xdd0000, 100};
    const int stepColorScale_size = (int)(sizeof(stepColorScale)/sizeof(*stepColorScale));
    double highColorScale[] = {70, Chart::Transparent, 100, 0xff0000};
    const int highColorScale_size = (int)(sizeof(highColorScale)/sizeof(*highColorScale));

    if (chartIndex == 1) {
        // Add the smooth color scale just outside the inner circle
        m->addColorScale(DoubleArray(smoothColorScale, smoothColorScale_size), innerRadius + 1,
            colorScaleWidth);
        // Add glare up to the scale radius, concave and spanning 190 degrees
        m->addGlare(scaleRadius, -190);
    } else if (chartIndex == 2) {
        // Add the high color scale at the default position
        m->addColorScale(DoubleArray(highColorScale, highColorScale_size));
        // Add glare up to the scale radius
        m->addGlare(scaleRadius);
    } else {
        // Add the step color scale just outside the inner circle
        m->addColorScale(DoubleArray(stepColorScale, stepColorScale_size), innerRadius + 1,
            colorScaleWidth);
        // Add glare up to the scale radius, concave and spanning 190 degrees and rotated by -45
        // degrees
        m->addGlare(scaleRadius, -190, -45);
    }

    // Add a red (0xff0000) pointer at the specified value
    m->addPointer2(value, 0xff0000);

    // Set the cap background to a brighter version of the mainColor, and using black (0x000000) for
    // the cap and grey (0x999999) for the cap border
    m->setCap2(m->adjustBrightness(mainColor, 1.1), 0x000000, 0x999999);

    // Output the chart
    m->makeChart(filename);

    //free up resources
    delete m;

}

int main(int argc, char *argv[])
{
    createChart(0, "neonroundmeter0.png");
    createChart(1, "neonroundmeter1.png");
    createChart(2, "neonroundmeter2.png");
    createChart(3, "neonroundmeter3.png");
    return 0;
}
© 2023 Advanced Software Engineering Limited. All rights reserved.