The following is the command line version of the code in "cppdemo/polarvector". The MFC version of the code is in "mfcdemo/mfcdemo". The Qt Widgets version of the code is in "qtdemo/qtdemo". The QML/Qt Quick version of the code is in "qmldemo/qmldemo".
#include "chartdir.h"
int main(int argc, char *argv[])
{
// Coordinates of the starting points of the vectors
double radius[] = {5, 5, 5, 5, 5, 5, 5, 5, 5, 5, 5, 5, 10, 10, 10, 10, 10, 10, 10, 10, 10, 10,
10, 10, 15, 15, 15, 15, 15, 15, 15, 15, 15, 15, 15, 15, 20, 20, 20, 20, 20, 20, 20, 20, 20,
20, 20, 20, 25, 25, 25, 25, 25, 25, 25, 25, 25, 25, 25, 25};
const int radius_size = (int)(sizeof(radius)/sizeof(*radius));
double angle[] = {0, 30, 60, 90, 120, 150, 180, 210, 240, 270, 300, 330, 0, 30, 60, 90, 120,
150, 180, 210, 240, 270, 300, 330, 0, 30, 60, 90, 120, 150, 180, 210, 240, 270, 300, 330, 0,
30, 60, 90, 120, 150, 180, 210, 240, 270, 300, 330, 0, 30, 60, 90, 120, 150, 180, 210, 240,
270, 300, 330};
const int angle_size = (int)(sizeof(angle)/sizeof(*angle));
// Magnitude and direction of the vectors
double magnitude[] = {5, 5, 5, 5, 5, 5, 5, 5, 5, 5, 5, 5, 4, 4, 4, 4, 4, 4, 4, 4, 4, 4, 4, 4, 3,
3, 3, 3, 3, 3, 3, 3, 3, 3, 3, 3, 2, 2, 2, 2, 2, 2, 2, 2, 2, 2, 2, 2, 1, 1, 1, 1, 1, 1, 1, 1,
1, 1, 1, 1};
const int magnitude_size = (int)(sizeof(magnitude)/sizeof(*magnitude));
double direction[] = {60, 90, 120, 150, 180, 210, 240, 270, 300, 330, 0, 30, 60, 90, 120, 150,
180, 210, 240, 270, 300, 330, 0, 30, 60, 90, 120, 150, 180, 210, 240, 270, 300, 330, 0, 30,
60, 90, 120, 150, 180, 210, 240, 270, 300, 330, 0, 30, 60, 90, 120, 150, 180, 210, 240, 270,
300, 330, 0, 30};
const int direction_size = (int)(sizeof(direction)/sizeof(*direction));
// Create a PolarChart object of size 460 x 460 pixels
PolarChart* c = new PolarChart(460, 460);
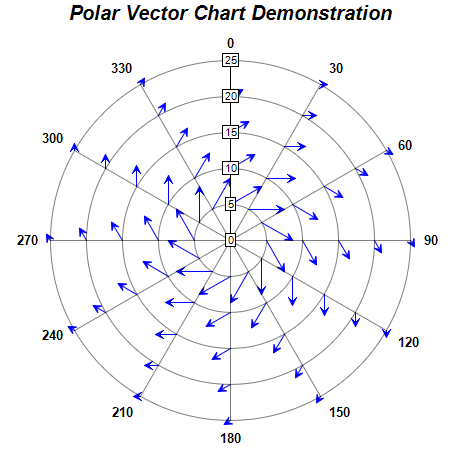
// Add a title to the chart at the top left corner using 15pt Arial Bold Italic font
c->addTitle("Polar Vector Chart Demonstration", "Arial Bold Italic", 15);
// Set center of plot area at (230, 240) with radius 180 pixels
c->setPlotArea(230, 240, 180);
// Set the grid style to circular grid
c->setGridStyle(false);
// Set angular axis as 0 - 360, with a spoke every 30 units
c->angularAxis()->setLinearScale(0, 360, 30);
// Add a polar vector layer to the chart with blue (0000ff) vectors
c->addVectorLayer(DoubleArray(radius, radius_size), DoubleArray(angle, angle_size), DoubleArray(
magnitude, magnitude_size), DoubleArray(direction, direction_size), Chart::RadialAxisScale,
0x0000ff);
// Output the chart
c->makeChart("polarvector.png");
//free up resources
delete c;
return 0;
}
© 2023 Advanced Software Engineering Limited. All rights reserved.