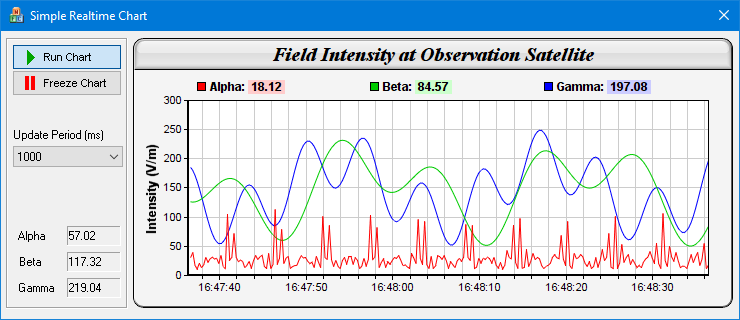
This sample program demonstrates a real-time chart with configurable chart update rate.
In this sample program, new values are generated by a random number generator driven by a timer. The values are "shifted" into data arrays, which are used for creating the chart.
The chart is updated by a second timer. This allows the chart update rate to be configurable independently from the data rate. Also, the chart can be "frozen" for easy reading, while the data can continue to update on the background.
To demonstrate the code structure for update rate control (even though for the update rate in this demo it is not necessary to have any rate control), instead of directly updating the chart, the chart update timer calls
CChartViewer.updateViewPort to emit the
CVN_ViewPortChanged message, and the chart is updated in its handler.
[MFC version] mfcdemo/RealTimeDemoDlg.cpp
// RealTimeDemoDlg.cpp : implementation file
//

#include "stdafx.h"
#include "resource.h"
#include "RealTimeDemoDlg.h"
#include <math.h>

#ifdef _DEBUG
#define new DEBUG_NEW
#endif

/////////////////////////////////////////////////////////////////////////////
// CRealTimeDemoDlg dialog

static const int DataRateTimer = 1;
static const int ChartUpdateTimer = 2;

// 250ms per data point, chart contains 1 min of data = 240 data points.
static const int DataInterval = 250;
static const int sampleSize = 240;

//
// Constructor
//
CRealTimeDemoDlg::CRealTimeDemoDlg(CWnd* pParent /*=NULL*/)
    : CDialog(IDD_REALTIMEDEMO, pParent)
{
}

void CRealTimeDemoDlg::DoDataExchange(CDataExchange* pDX)
{
    CDialog::DoDataExchange(pDX);
    DDX_Control(pDX, IDC_GammaValue, m_ValueC);
    DDX_Control(pDX, IDC_BetaValue, m_ValueB);
    DDX_Control(pDX, IDC_AlphaValue, m_ValueA);
    DDX_Control(pDX, IDC_ChartViewer, m_ChartViewer);
    DDX_Control(pDX, IDC_RunPB, m_RunPB);
    DDX_Control(pDX, IDC_UpdatePeriod, m_UpdatePeriod);
    //}}AFX_DATA_MAP
}

BEGIN_MESSAGE_MAP(CRealTimeDemoDlg, CDialog)
    ON_WM_TIMER()
    ON_BN_CLICKED(IDC_RunPB, OnRunPB)
    ON_BN_CLICKED(IDC_FreezePB, OnFreezePB)
    ON_CBN_SELCHANGE(IDC_UpdatePeriod, OnSelchangeUpdatePeriod)
    ON_CONTROL(CVN_ViewPortChanged, IDC_ChartViewer, OnViewPortChanged)
END_MESSAGE_MAP()

//
// Initialization
//
BOOL CRealTimeDemoDlg::OnInitDialog()
{
    CDialog::OnInitDialog();

    //
    // Initialize member variables
    //

    // Allocate memory for the data series and initialize to Chart::NoValue
    m_timeStamps.resize(sampleSize, Chart::NoValue);
    m_dataSeriesA.resize(sampleSize, Chart::NoValue);
    m_dataSeriesB.resize(sampleSize, Chart::NoValue);
    m_dataSeriesC.resize(sampleSize, Chart::NoValue);

    m_extBgColor = getDefaultBgColor();     // Default background color

    // Set m_nextDataTime to the current time. It is used by the real time random number
    // generator so it knows what timestamp should be used for the next data point.
    SYSTEMTIME st;
    GetLocalTime(&st);
    m_nextDataTime = Chart::chartTime(st.wYear, st.wMonth, st.wDay, st.wHour, st.wMinute,
        st.wSecond) + st.wMilliseconds / 1000.0;

    //
    // Initialize controls
    //

    // Set up the data acquisition mechanism. In this demo, we just use a timer to get a
    // sample every 250ms.
    SetTimer(DataRateTimer, DataInterval, 0);

    // The chart update rate (in ms)
    m_UpdatePeriod.SelectString(0, _T("250"));

    // Load icons for the Run/Freeze buttons
    loadButtonIcon(IDC_RunPB, IDI_RunPB, 100, 20);
    loadButtonIcon(IDC_FreezePB, IDI_FreezePB, 100, 20);

    // Initially set the Run mode
    m_RunPB.SetCheck(1);
    OnRunPB();

    return TRUE;
}

//
// User clicks on the Run pushbutton
//
void CRealTimeDemoDlg::OnRunPB()
{
    // Enable chart update timer
    CString s;
    m_UpdatePeriod.GetLBText(m_UpdatePeriod.GetCurSel(), s);
    SetTimer(ChartUpdateTimer, _tcstol(s, 0, 0), 0);
}

//
// User clicks on the Freeze pushbutton
//
void CRealTimeDemoDlg::OnFreezePB()
{
    // Disable chart update timer
    KillTimer(ChartUpdateTimer);
}

//
// Handles timer events
//
void CRealTimeDemoDlg::OnTimer(UINT_PTR nIDEvent)
{
    switch (nIDEvent)
    {
    case DataRateTimer:
        // Is data acquisition timer - get a new data sample
        getData();
        break;
    case ChartUpdateTimer:
        // Is chart update timer - request chart update
        m_ChartViewer.updateViewPort(true, false);
        break;
    }

    CDialog::OnTimer(nIDEvent);
}

//
// View port changed event
//
void CRealTimeDemoDlg::OnViewPortChanged()
{
    drawChart(&m_ChartViewer);
}

//
// User changes the chart update period
//
void CRealTimeDemoDlg::OnSelchangeUpdatePeriod()
{
    if (m_RunPB.GetCheck())
    {
        // Call freeze then run to use the new chart update period
        OnFreezePB();
        OnRunPB();
    }
}

//
// A utility to shift a new data value into a data array
//
static void shiftData(double *data, int len, double newValue)
{
    memmove(data, data + 1, sizeof(*data) * (len - 1));
    data[len - 1] = newValue;
}

//
// The data acquisition routine. In this demo, this is invoked every 250ms.
//
void CRealTimeDemoDlg::getData()
{
    // The current time in millisecond resolution
    SYSTEMTIME st;
    GetLocalTime(&st);
    double now = Chart::chartTime(st.wYear, st.wMonth, st.wDay, st.wHour, st.wMinute,
        st.wSecond) + st.wMilliseconds / 1000.0;

    // This is our formula for the random number generator
    do
    {
        // Get a data sample
        double p = m_nextDataTime * 4;
        double dataA = 20 + cos(p * 129241) * 10 + 1 / (cos(p) * cos(p) + 0.01);
        double dataB = 150 + 100 * sin(p / 27.7) * sin(p / 10.1);
        double dataC = 150 + 100 * cos(p / 6.7) * cos(p / 11.9);

        // Shift the values into the arrays
        shiftData(&m_dataSeriesA[0], (int)m_dataSeriesA.size(), dataA);
        shiftData(&m_dataSeriesB[0], (int)m_dataSeriesB.size(), dataB);
        shiftData(&m_dataSeriesC[0], (int)m_dataSeriesC.size(), dataC);
        shiftData(&m_timeStamps[0], (int)m_timeStamps.size(), m_nextDataTime);

        m_nextDataTime += DataInterval / 1000.0;
    }
    while (m_nextDataTime < now);

    //
    // We provide some visual feedback to the latest numbers generated, so you can see the
    // data being generated.
    //
    char buffer[1024];

    sprintf_s(buffer, sizeof(buffer), "%.2f", m_dataSeriesA[sampleSize - 1]);
    m_ValueA.SetWindowText(CString(buffer));

    sprintf_s(buffer, sizeof(buffer), "%.2f", m_dataSeriesB[sampleSize - 1]);
    m_ValueB.SetWindowText(CString(buffer));

    sprintf_s(buffer, sizeof(buffer), "%.2f", m_dataSeriesC[sampleSize - 1]);
    m_ValueC.SetWindowText(CString(buffer));
}

//
// Draw the chart and display it in the given viewer
//
void CRealTimeDemoDlg::drawChart(CChartViewer *viewer)
{
    // Create an XYChart object 600 x 270 pixels in size, with light grey (f4f4f4)
    // background, black (000000) border, 1 pixel raised effect, and with a rounded frame.
    XYChart *c = new XYChart(600, 270, 0xf4f4f4, 0x000000, 1);
    c->setRoundedFrame(m_extBgColor);

    // Set the plotarea at (55, 62) and of size 520 x 175 pixels. Use white (ffffff)
    // background. Enable both horizontal and vertical grids by setting their colors to
    // grey (cccccc). Set clipping mode to clip the data lines to the plot area.
    c->setPlotArea(55, 62, 520, 175, 0xffffff, -1, -1, 0xcccccc, 0xcccccc);
    c->setClipping();

    // Add a title to the chart using 15 pts Times New Roman Bold Italic font, with a light
    // grey (dddddd) background, black (000000) border, and a glass like raised effect.
    c->addTitle("Field Intensity at Observation Satellite", "Times New Roman Bold Italic",
        15)->setBackground(0xdddddd, 0x000000, Chart::glassEffect());

    // Add a legend box at the top of the plot area with 9pts Arial Bold font. We set the
    // legend box to the same width as the plot area and use grid layout (as opposed to
    // flow or top/down layout). This distributes the 3 legend icons evenly on top of the
    // plot area.
    LegendBox *b = c->addLegend2(55, 33, 3, "Arial Bold", 9);
    b->setBackground(Chart::Transparent, Chart::Transparent);
    b->setWidth(520);

    // Configure the y-axis with a 10pts Arial Bold axis title
    c->yAxis()->setTitle("Intensity (V/m)", "Arial Bold", 10);

    // Configure the x-axis to auto-scale with at least 75 pixels between major tick and
    // 15  pixels between minor ticks. This shows more minor grid lines on the chart.
    c->xAxis()->setTickDensity(75, 15);

    // Set the axes width to 2 pixels
    c->xAxis()->setWidth(2);
    c->yAxis()->setWidth(2);

    // Now we add the data to the chart.
    double lastTime = m_timeStamps[sampleSize - 1];
    if (lastTime != Chart::NoValue)
    {
        // Set up the x-axis to show the time range in the data buffer
        c->xAxis()->setDateScale(lastTime - DataInterval * sampleSize / 1000, lastTime);

        // Set the x-axis label format
        c->xAxis()->setLabelFormat("{value|hh:nn:ss}");

        // Create a line layer to plot the lines
        LineLayer *layer = c->addLineLayer();

        // The x-coordinates are the timeStamps.
        layer->setXData(vectorToArray(m_timeStamps));

        // The 3 data series are used to draw 3 lines. Here we put the latest data values
        // as part of the data set name, so you can see them updated in the legend box.
        char buffer[1024];

        sprintf_s(buffer, sizeof(buffer), "Alpha: <*bgColor=FFCCCC*> %.2f ", m_dataSeriesA.back());
        layer->addDataSet(vectorToArray(m_dataSeriesA), 0xff0000, buffer);

        sprintf_s(buffer, sizeof(buffer), "Beta: <*bgColor=CCFFCC*> %.2f ", m_dataSeriesB.back());
        layer->addDataSet(vectorToArray(m_dataSeriesB), 0x00cc00, buffer);

        sprintf_s(buffer, sizeof(buffer), "Gamma: <*bgColor=CCCCFF*> %.2f ", m_dataSeriesC.back());
        layer->addDataSet(vectorToArray(m_dataSeriesC), 0x0000ff, buffer);
    }

    // Set the chart image to the WinChartViewer
    viewer->setChart(c);
    delete c;
}

/////////////////////////////////////////////////////////////////////////////
// General utilities

//
// Get the default background color
//
int CRealTimeDemoDlg::getDefaultBgColor()
{
    LOGBRUSH LogBrush;
    HBRUSH hBrush = (HBRUSH)SendMessage(WM_CTLCOLORDLG, (WPARAM)CClientDC(this).m_hDC,
        (LPARAM)m_hWnd);
    ::GetObject(hBrush, sizeof(LOGBRUSH), &LogBrush);
    int ret = LogBrush.lbColor;
    return ((ret & 0xff) << 16) | (ret & 0xff00) | ((ret & 0xff0000) >> 16);
}

//
// Load an icon resource into a button
//
void CRealTimeDemoDlg::loadButtonIcon(int buttonId, int iconId, int width, int height)
{
    // Resize the icon to match the screen DPI for high DPI support
    HDC screen = ::GetDC(0);
    double scaleFactor = GetDeviceCaps(screen, LOGPIXELSX) / 96.0;
    ::ReleaseDC(0, screen);
    width = (int)(width * scaleFactor + 0.5);
    height = (int)(height * scaleFactor + 0.5);

    GetDlgItem(buttonId)->SendMessage(BM_SETIMAGE, IMAGE_ICON, (LPARAM)::LoadImage(
        AfxGetResourceHandle(), MAKEINTRESOURCE(iconId), IMAGE_ICON, width, height, LR_DEFAULTCOLOR));
}

//
// Convert std::vector to a DoubleArray
//
DoubleArray CRealTimeDemoDlg::vectorToArray(const std::vector<double>& v, int startIndex, int length)
{
    if ((length < 0) || (length + startIndex > (int)v.size()))
        length = ((int)v.size()) - startIndex;
    return (length <= 0) ? DoubleArray() : DoubleArray(&(v[startIndex]), length);
}
© 2023 Advanced Software Engineering Limited. All rights reserved.