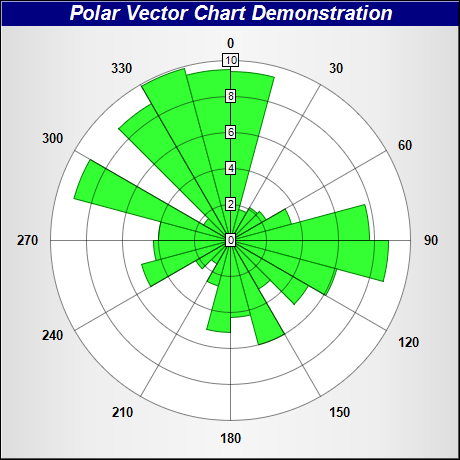
This example demonstrates how to create a rose chart.
A rose chart is basically a polar chart with sectors of variable radius. This can be achieved by creating a
PolarChart object as the graph paper, and adding sector zones on it using
AngularAxis.addZone.
To enable auto-scale of the axis, in this example, we also add the radius data to a transparent line layer using
PolarChart.addLineLayer. The line layer has no visible effect, but it causes the radial axis to auto-scale so that it covers the radius data.
The following is the command line version of the code in "cppdemo/rose". The MFC version of the code is in "mfcdemo/mfcdemo". The Qt Widgets version of the code is in "qtdemo/qtdemo". The QML/Qt Quick version of the code is in "qmldemo/qmldemo".
#include "chartdir.h"

int main(int argc, char *argv[])
{
    // Data for the chart
    double data[] = {9.4, 1.8, 2.1, 2.3, 3.5, 7.7, 8.8, 6.1, 5.0, 3.1, 6.0, 4.3, 5.1, 2.6, 1.5, 2.2,
        5.1, 4.3, 4.0, 9.0, 1.7, 8.8, 9.9, 9.5};
    const int data_size = (int)(sizeof(data)/sizeof(*data));
    double angles[] = {0, 15, 30, 45, 60, 75, 90, 105, 120, 135, 150, 165, 180, 195, 210, 225, 240,
        255, 270, 285, 300, 315, 330, 345};
    const int angles_size = (int)(sizeof(angles)/sizeof(*angles));

    // Create a PolarChart object of size 460 x 460 pixels, with a silver background and a 1 pixel
    // 3D border
    PolarChart* c = new PolarChart(460, 460, Chart::silverColor(), 0x000000, 1);

    // Add a title to the chart at the top left corner using 15pt Arial Bold Italic font. Use white
    // text on deep blue background.
    c->addTitle("Polar Vector Chart Demonstration", "Arial Bold Italic", 15, 0xffffff
        )->setBackground(0x000080);

    // Set plot area center at (230, 240) with radius 180 pixels and white background
    c->setPlotArea(230, 240, 180, 0xffffff);

    // Set the grid style to circular grid
    c->setGridStyle(false);

    // Set angular axis as 0 - 360, with a spoke every 30 units
    c->angularAxis()->setLinearScale(0, 360, 30);

    // Add sectors to the chart as sector zones
    for(int i = 0; i < data_size; ++i) {
        c->angularAxis()->addZone(angles[i], angles[i] + 15, 0, data[i], 0x33ff33, 0x008000);
    }

    // Add an Transparent invisible layer to ensure the axis is auto-scaled using the data
    c->addLineLayer(DoubleArray(data, data_size), Chart::Transparent);

    // Output the chart
    c->makeChart("rose.png");

    //free up resources
    delete c;

    return 0;
}
© 2023 Advanced Software Engineering Limited. All rights reserved.