The following is the command line version of the code in "cppdemo/scattercontour". The MFC version of the code is in "mfcdemo/mfcdemo". The Qt Widgets version of the code is in "qtdemo/qtdemo". The QML/Qt Quick version of the code is in "qmldemo/qmldemo".
#include "chartdir.h"
int main(int argc, char *argv[])
{
// The (x, y, z) coordinates of the scattered data
double dataX[] = {0.5, 1.9, 4.9, 1.0, 8.9, 9.8, 5.9, 2.9, 6.8, 9.0, 0.0, 8.9, 1.9, 4.8, 2.4,
3.4, 7.9, 7.5, 4.8, 7.5, 9.5, 0.4, 8.9, 0.9, 5.4, 9.4, 2.9, 8.9, 0.9, 8.9, 10.0, 1.0, 6.8,
3.8, 9.0, 5.3, 6.4, 4.9, 4.5, 2.0, 5.4, 0.0, 10.0, 3.9, 5.4, 5.9, 5.8, 0.3, 4.4, 8.3};
const int dataX_size = (int)(sizeof(dataX)/sizeof(*dataX));
double dataY[] = {3.3, 3.0, 0.7, 1.0, 9.3, 4.5, 8.4, 0.1, 0.8, 0.1, 9.3, 1.8, 4.3, 1.3, 2.3,
5.4, 6.9, 9.0, 9.8, 7.5, 1.8, 1.4, 4.5, 7.8, 3.8, 4.0, 2.9, 2.4, 3.9, 2.9, 2.3, 9.3, 2.0,
3.4, 4.8, 2.3, 3.4, 2.3, 1.5, 7.8, 4.5, 0.9, 6.3, 2.4, 6.9, 2.8, 1.3, 2.9, 6.4, 6.3};
const int dataY_size = (int)(sizeof(dataY)/sizeof(*dataY));
double dataZ[] = {6.6, 12.5, 7.4, 6.2, 9.6, 13.6, 19.9, 2.2, 6.9, 3.4, 8.7, 8.4, 7.8, 8.0, 9.4,
11.9, 9.6, 15.7, 12.0, 13.3, 9.6, 6.4, 9.0, 6.9, 4.6, 9.7, 10.6, 9.2, 7.0, 6.9, 9.7, 8.6,
8.0, 13.6, 13.2, 5.9, 9.0, 3.2, 8.3, 9.7, 8.2, 6.1, 8.7, 5.6, 14.9, 9.8, 9.3, 5.1, 10.8, 9.8
};
const int dataZ_size = (int)(sizeof(dataZ)/sizeof(*dataZ));
// Create a XYChart object of size 450 x 540 pixels
XYChart* c = new XYChart(450, 540);
// Add a title to the chart using 15 points Arial Italic font
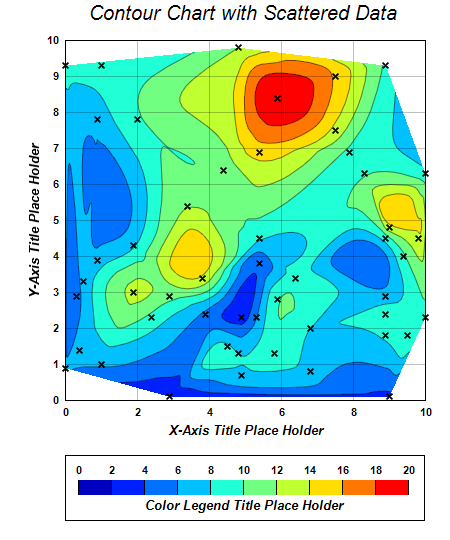
c->addTitle(" Contour Chart with Scattered Data", "Arial Italic", 15);
// Set the plotarea at (65, 40) and of size 360 x 360 pixels. Use semi-transparent black
// (c0000000) for both horizontal and vertical grid lines
c->setPlotArea(65, 40, 360, 360, -1, -1, -1, 0xc0000000, -1);
// Set x-axis and y-axis title using 12 points Arial Bold Italic font
c->xAxis()->setTitle("X-Axis Title Place Holder", "Arial Bold Italic", 10);
c->yAxis()->setTitle("Y-Axis Title Place Holder", "Arial Bold Italic", 10);
// Set x-axis and y-axis labels to use Arial Bold font
c->xAxis()->setLabelStyle("Arial Bold");
c->yAxis()->setLabelStyle("Arial Bold");
// When x-axis and y-axis color to transparent
c->xAxis()->setColors(Chart::Transparent);
c->yAxis()->setColors(Chart::Transparent);
// Add a scatter layer to the chart to show the position of the data points.
c->addScatterLayer(DoubleArray(dataX, dataX_size), DoubleArray(dataY, dataY_size), "",
Chart::Cross2Shape(0.2), 7, 0x000000);
// Add a contour layer using the given data
ContourLayer* layer = c->addContourLayer(DoubleArray(dataX, dataX_size), DoubleArray(dataY,
dataY_size), DoubleArray(dataZ, dataZ_size));
// Move the grid lines in front of the contour layer
c->getPlotArea()->moveGridBefore(layer);
// Add a color axis (the legend) in which the top center is anchored at (245, 455). Set the
// length to 330 pixels and the labels on the top side.
ColorAxis* cAxis = layer->setColorAxis(245, 455, Chart::TopCenter, 330, Chart::Top);
// Add a bounding box to the color axis using the default line color as border.
cAxis->setBoundingBox(Chart::Transparent, Chart::LineColor);
// Add a title to the color axis using 12 points Arial Bold Italic font
cAxis->setTitle("Color Legend Title Place Holder", "Arial Bold Italic", 10);
// Set color axis labels to use Arial Bold font
cAxis->setLabelStyle("Arial Bold");
// Set the color axis range as 0 to 20, with a step every 2 units
cAxis->setLinearScale(0, 20, 2);
// Output the chart
c->makeChart("scattercontour.png");
//free up resources
delete c;
return 0;
}
© 2023 Advanced Software Engineering Limited. All rights reserved.