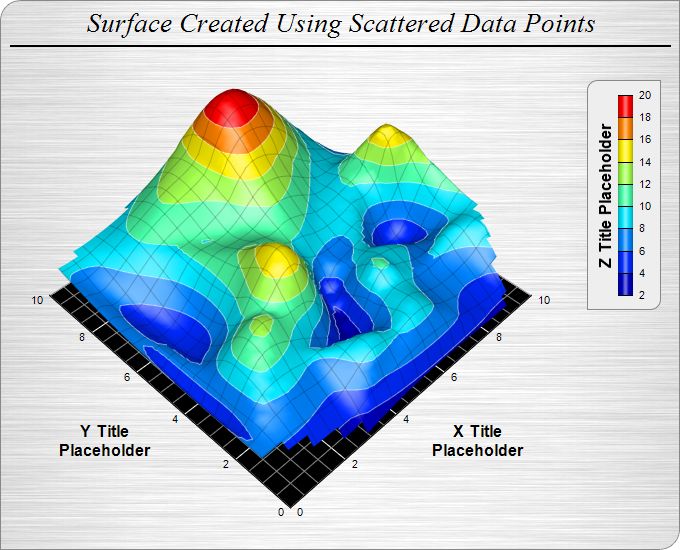
This example demonstrates using scattered data for the surface chart. It also demonstrates hiding the plot region walls and changing their thickness and colors.
In previous surface chart examples, the data are gridded, which means the (x, y) coordinates of the data points lie on a rectangular grid. ChartDirector also supports scattered data points, which means the data points can be at arbitrary positions. ChartDirector automatically detects if the data passed to the surface chart using
SurfaceChart.setData are gridded or scattered.
In this example, 2 of the 3 plot region walls are hidden using
ThreeDChart.setWallVisibility. For the visible wall, its color is set to black using
ThreeDChart.setWallColor, its thickness is set to 0 using
ThreeDChart.setWallThickness, and its major and minor grid lines are set to white and grey using
ThreeDChart.setWallGrid.
The following is the command line version of the code in "cppdemo/scattersurface". The MFC version of the code is in "mfcdemo/mfcdemo". The Qt Widgets version of the code is in "qtdemo/qtdemo". The QML/Qt Quick version of the code is in "qmldemo/qmldemo".
#include "chartdir.h"

int main(int argc, char *argv[])
{
    // The (x, y, z) coordinates of the scattered data
    double dataX[] = {0.5, 1.9, 4.9, 1.0, 8.9, 9.8, 5.9, 2.9, 6.8, 9.0, 0.0, 8.9, 1.9, 4.8, 2.4,
        3.4, 7.9, 7.5, 4.8, 7.5, 9.5, 0.4, 8.9, 0.9, 5.4, 9.4, 2.9, 8.9, 0.9, 8.9, 10.0, 1.0, 6.8,
        3.8, 9.0, 5.3, 6.4, 4.9, 4.5, 2.0, 5.4, 0.0, 10.0, 3.9, 5.4, 5.9, 5.8, 0.3, 4.4, 8.3};
    const int dataX_size = (int)(sizeof(dataX)/sizeof(*dataX));
    double dataY[] = {3.3, 3.0, 0.7, 1.0, 9.3, 4.5, 8.4, 0.1, 0.8, 0.1, 9.3, 1.8, 4.3, 1.3, 2.3,
        5.4, 6.9, 9.0, 9.8, 7.5, 1.8, 1.4, 4.5, 7.8, 3.8, 4.0, 2.9, 2.4, 3.9, 2.9, 2.3, 9.3, 2.0,
        3.4, 4.8, 2.3, 3.4, 2.3, 1.5, 7.8, 4.5, 0.9, 6.3, 2.4, 6.9, 2.8, 1.3, 2.9, 6.4, 6.3};
    const int dataY_size = (int)(sizeof(dataY)/sizeof(*dataY));
    double dataZ[] = {6.6, 12.5, 7.4, 6.2, 9.6, 13.6, 19.9, 2.2, 6.9, 3.4, 8.7, 8.4, 7.8, 8.0, 9.4,
        11.9, 9.6, 15.7, 12.0, 13.3, 9.6, 6.4, 9.0, 6.9, 4.6, 9.7, 10.6, 9.2, 7.0, 6.9, 9.7, 8.6,
        8.0, 13.6, 13.2, 5.9, 9.0, 3.2, 8.3, 9.7, 8.2, 6.1, 8.7, 5.6, 14.9, 9.8, 9.3, 5.1, 10.8, 9.8
        };
    const int dataZ_size = (int)(sizeof(dataZ)/sizeof(*dataZ));

    // Create a SurfaceChart object of size 680 x 550 pixels. Set background to brushed silver and
    // border to grey (888888). Set the top-left and bottom-right corners to rounded corners with 20
    // pixels radius.
    SurfaceChart* c = new SurfaceChart(680, 550, Chart::brushedSilverColor(), 0x888888);
    c->setRoundedFrame(0xffffff, 20, 0, 20, 0);

    // Add a title to the chart using 20 points Times New Roman Italic font. Set top/bottom margin
    // to 8 pixels.
    TextBox* title = c->addTitle("Surface Created Using Scattered Data Points",
        "Times New Roman Italic", 20);
    title->setMargin(0, 0, 8, 8);

    // Add a 2 pixel wide black (000000) separator line under the title
    c->addLine(10, title->getHeight(), c->getWidth() - 10, title->getHeight(), 0x000000, 2);

    // Set the center of the plot region at (290, 235), and set width x depth x height to 360 x 360
    // x 180 pixels
    c->setPlotRegion(290, 235, 360, 360, 180);

    // Set the elevation and rotation angles to 45 and -45 degrees
    c->setViewAngle(45, -45);

    // Set the perspective level to 30
    c->setPerspective(30);

    // Set the data to use to plot the chart
    c->setData(DoubleArray(dataX, dataX_size), DoubleArray(dataY, dataY_size), DoubleArray(dataZ,
        dataZ_size));

    // Add a color axis (the legend) in which the top right corner is anchored at (660, 80). Set the
    // length to 200 pixels and the labels on the right side.
    ColorAxis* cAxis = c->setColorAxis(660, 80, Chart::TopRight, 200, Chart::Right);

    // Set the color axis title with 12 points Arial Bold font
    cAxis->setTitle("Z Title Placeholder", "Arial Bold", 12);

    // Add a bounding box with light grey (eeeeee) background and grey (888888) border. Set the
    // top-left and bottom-right corners to rounded corners of  10 pixels radius.
    cAxis->setBoundingBox(0xeeeeee, 0x888888);
    cAxis->setRoundedCorners(10, 0, 10, 0);

    // Set surface grid lines to semi-transparent black (cc000000)
    c->setSurfaceAxisGrid(0xcc000000);

    // Set contour lines to semi-transparent white (80ffffff)
    c->setContourColor(0x80ffffff);

    // Set the walls to black in color
    c->setWallColor(0x000000);

    // Set the xyz major wall grid lines to white (ffffff), and minor wall grid lines to grey
    // (888888)
    c->setWallGrid(0xffffff, 0xffffff, 0xffffff, 0x888888, 0x888888, 0x888888);

    // Set the wall thickness to 0
    c->setWallThickness(0, 0, 0);

    // Show only the xy wall, and hide the yz and zx walls.
    c->setWallVisibility(true, false, false);

    // Set the x, y and z axis titles using 12 points Arial Bold font
    c->xAxis()->setTitle("X Title\nPlaceholder", "Arial Bold", 12);
    c->yAxis()->setTitle("Y Title\nPlaceholder", "Arial Bold", 12);

    // Output the chart
    c->makeChart("scattersurface.jpg");

    //free up resources
    delete c;

    return 0;
}
© 2023 Advanced Software Engineering Limited. All rights reserved.