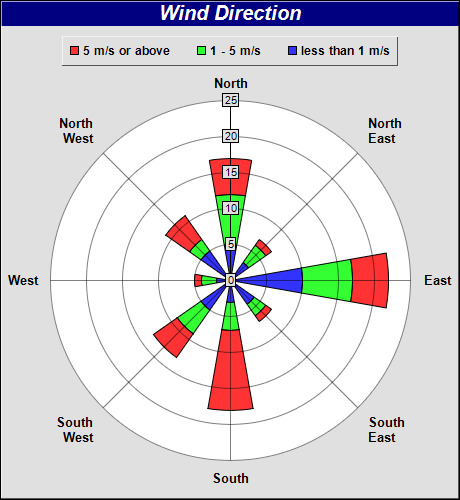
This example demonstrates how to create a stacked rose chart.
This example employs the same approach as the previous
Simple Rose Chart example. It creates a
PolarChart object as the graph paper, and adding sector zones on it using
AngularAxis.addZone. A transparent line layer is used for enabling auto-scaling.
In this example, multiple sectors are added for each angular direction, creating a "stacked" effect.
The following is the command line version of the code in "cppdemo/stackrose". The MFC version of the code is in "mfcdemo/mfcdemo". The Qt Widgets version of the code is in "qtdemo/qtdemo". The QML/Qt Quick version of the code is in "qmldemo/qmldemo".
#include "chartdir.h"

int main(int argc, char *argv[])
{
    // Data for the chart
    double data0[] = {5, 3, 10, 4, 3, 5, 2, 5};
    const int data0_size = (int)(sizeof(data0)/sizeof(*data0));
    double data1[] = {12, 6, 17, 6, 7, 9, 4, 7};
    const int data1_size = (int)(sizeof(data1)/sizeof(*data1));
    double data2[] = {17, 7, 22, 7, 18, 13, 5, 11};
    const int data2_size = (int)(sizeof(data2)/sizeof(*data2));

    double angles[] = {0, 45, 90, 135, 180, 225, 270, 315};
    const int angles_size = (int)(sizeof(angles)/sizeof(*angles));
    const char* labels[] = {"North", "North\nEast", "East", "South\nEast", "South", "South\nWest",
        "West", "North\nWest"};
    const int labels_size = (int)(sizeof(labels)/sizeof(*labels));

    // Create a PolarChart object of size 460 x 500 pixels, with a grey (e0e0e0) background and a 1
    // pixel 3D border
    PolarChart* c = new PolarChart(460, 500, 0xe0e0e0, 0x000000, 1);

    // Add a title to the chart at the top left corner using 15pt Arial Bold Italic font. Use white
    // text on deep blue background.
    c->addTitle("Wind Direction", "Arial Bold Italic", 15, 0xffffff)->setBackground(0x000080);

    LegendBox* legendBox = c->addLegend(230, 35, false, "Arial Bold", 9);
    legendBox->setAlignment(Chart::TopCenter);
    legendBox->setBackground(Chart::Transparent, Chart::Transparent, 1);

    legendBox->addKey("5 m/s or above", 0xff3333);
    legendBox->addKey("1 - 5 m/s", 0x33ff33);
    legendBox->addKey("less than 1 m/s", 0x3333ff);

    // Set plot area center at (230, 280) with radius 180 pixels and white background
    c->setPlotArea(230, 280, 180, 0xffffff);

    // Set the grid style to circular grid
    c->setGridStyle(false);

    // Set angular axis as 0 - 360, with a spoke every 30 units
    c->angularAxis()->setLinearScale(0, 360, StringArray(labels, labels_size));

    for(int i = 0; i < angles_size; ++i) {
        c->angularAxis()->addZone(angles[i] - 10, angles[i] + 10, 0, data0[i], 0x3333ff, 0);
        c->angularAxis()->addZone(angles[i] - 10, angles[i] + 10, data0[i], data1[i], 0x33ff33, 0);
        c->angularAxis()->addZone(angles[i] - 10, angles[i] + 10, data1[i], data2[i], 0xff3333, 0);
    }

    // Add an Transparent invisible layer to ensure the axis is auto-scaled using the data
    c->addLineLayer(DoubleArray(data2, data2_size), Chart::Transparent);

    // Output the chart
    c->makeChart("stackrose.png");

    //free up resources
    delete c;

    return 0;
}
© 2023 Advanced Software Engineering Limited. All rights reserved.