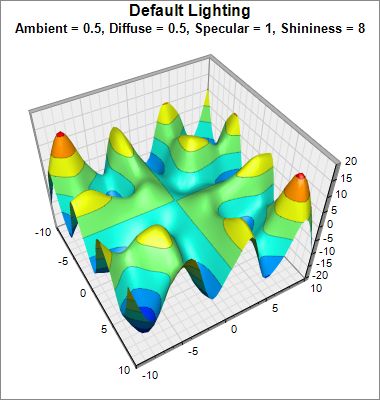
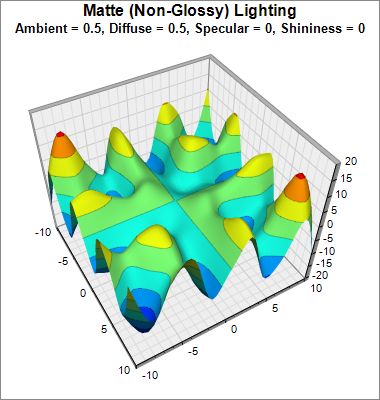
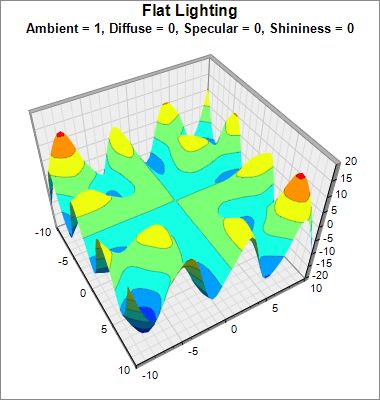
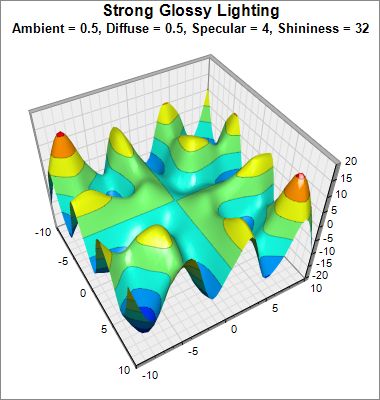
This example demonstrates the effects of various surface lighting parameters, configured using SurfaceChart.setLighting.
ChartDirector 7.1 (C++ Edition)
Surface Lighting
Source Code Listing
#include "chartdir.h"
#include <math.h>

void createChart(int chartIndex, const char *filename)
{
    // The x and y coordinates of the grid
    double dataX[] = {-10, -8, -6, -4, -2, 0, 2, 4, 6, 8, 10};
    const int dataX_size = (int)(sizeof(dataX)/sizeof(*dataX));
    double dataY[] = {-10, -8, -6, -4, -2, 0, 2, 4, 6, 8, 10};
    const int dataY_size = (int)(sizeof(dataY)/sizeof(*dataY));

    // The values at the grid points. In this example, we will compute the values using the formula
    // z = x * sin(y) + y * sin(x).
    const int dataZ_size = dataX_size * dataY_size;
    double dataZ[dataZ_size];
    for(int yIndex = 0; yIndex < dataY_size; ++yIndex) {
        double y = dataY[yIndex];
        for(int xIndex = 0; xIndex < dataX_size; ++xIndex) {
            double x = dataX[xIndex];
            dataZ[yIndex * dataX_size + xIndex] = x * sin(y) + y * sin(x);
        }
    }

    // Create a SurfaceChart object of size 380 x 400 pixels, with white (ffffff) background and
    // grey (888888) border.
    SurfaceChart* c = new SurfaceChart(380, 400, 0xffffff, 0x888888);

    // Demonstrate various lighting parameters
    if (chartIndex == 0) {
        c->addTitle(
            "Default Lighting<*br*><*size=10*>Ambient = 0.5, Diffuse = 0.5, Specular = 1, "
            "Shininess = 8");
    } else if (chartIndex == 1) {
        c->addTitle(
            "Matte (Non-Glossy) Lighting<*br*><*size=10*>Ambient = 0.5, Diffuse = 0.5, Specular = "
            "0, Shininess = 0");
        c->setLighting(0.5, 0.5, 0, 0);
    } else if (chartIndex == 2) {
        c->addTitle(
            "Flat Lighting<*br*><*size=10*>Ambient = 1, Diffuse = 0, Specular = 0, Shininess = 0");
        c->setLighting(1, 0, 0, 0);
    } else {
        c->addTitle(
            "Strong Glossy Lighting<*br*><*size=10*>Ambient = 0.5, Diffuse = 0.5, Specular = 4, "
            "Shininess = 32");
        c->setLighting(0.5, 0.5, 4, 32);
    }

    // Set the center of the plot region at (175, 200), and set width x depth x height to 200 x 200
    // x 160 pixels
    c->setPlotRegion(175, 200, 200, 200, 160);

    // Set the plot region wall thichness to 5 pixels
    c->setWallThickness(5);

    // Set the elevation and rotation angles to 45 and 60 degrees
    c->setViewAngle(45, 60);

    // Set the perspective level to 35
    c->setPerspective(35);

    // Set the data to use to plot the chart
    c->setData(DoubleArray(dataX, dataX_size), DoubleArray(dataY, dataY_size), DoubleArray(dataZ,
        dataZ_size));

    // Spline interpolate data to a 50 x 50 grid for a smooth surface
    c->setInterpolation(50, 50);

    // Set contour lines to semi-transparent black (c0000000)
    c->setContourColor(0xc0000000);

    // Output the chart
    c->makeChart(filename);

    //free up resources
    delete c;

}

int main(int argc, char *argv[])
{
    createChart(0, "surfacelighting0.jpg");
    createChart(1, "surfacelighting1.jpg");
    createChart(2, "surfacelighting2.jpg");
    createChart(3, "surfacelighting3.jpg");
    return 0;
}