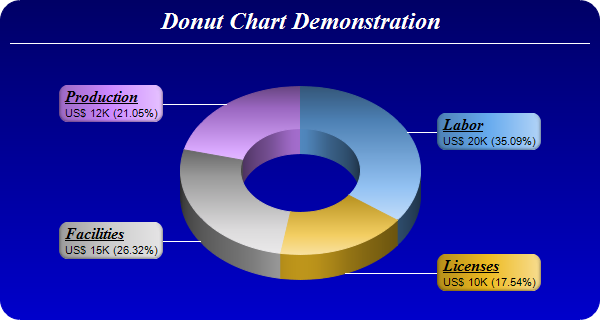
This example demonstrates a 3D donut chart with sector gradient shading. It also demonstrates gradient color background, rounded frame, custom sector colors, and using
CDML and
Parameter Substitution and Formatting to format sector labels
The following is the command line version of the code in "cppdemo/threeddonut". The MFC version of the code is in "mfcdemo/mfcdemo". The Qt Widgets version of the code is in "qtdemo/qtdemo". The QML/Qt Quick version of the code is in "qmldemo/qmldemo".
#include "chartdir.h"

int main(int argc, char *argv[])
{
    // The data for the pie chart
    double data[] = {20, 10, 15, 12};
    const int data_size = (int)(sizeof(data)/sizeof(*data));

    // The labels for the pie chart
    const char* labels[] = {"Labor", "Licenses", "Facilities", "Production"};
    const int labels_size = (int)(sizeof(labels)/sizeof(*labels));

    // The colors to use for the sectors
    int colors[] = {0x66aaee, 0xeebb22, 0xcccccc, 0xcc88ff};
    const int colors_size = (int)(sizeof(colors)/sizeof(*colors));

    // Create a PieChart object of size 600 x 320 pixels. Use a vertical gradient color from deep
    // blue (000066) to blue (0000cc) as background. Use rounded corners of 20 pixels radius.
    PieChart* c = new PieChart(600, 320);
    c->setBackground(c->linearGradientColor(0, 0, 0, c->getHeight(), 0x000066, 0x0000cc));
    c->setRoundedFrame(0xffffff, 20);

    // Add a title using 18pt Times New Roman Bold Italic font in white (ffffff) color. Set
    // top/bottom margins to 8 pixels.
    TextBox* title = c->addTitle("Donut Chart Demonstration", "Times New Roman Bold Italic", 18,
        0xffffff);
    title->setMargin(0, 0, 8, 8);

    // Add a separator line in white color just under the title
    c->addLine(10, title->getHeight(), c->getWidth() - 11, title->getHeight(), 0xffffff);

    // Set donut center at (300, 170), and outer/inner radii as 120/60 pixels
    c->setDonutSize(300, 170, 120, 60);

    // Draw the pie in 3D with a pie thickness of 25 pixels
    c->set3D(25);

    // Set the pie data and the pie labels
    c->setData(DoubleArray(data, data_size), StringArray(labels, labels_size));

    // Set the sector colors
    c->setColors(Chart::DataColor, IntArray(colors, colors_size));

    // Use local gradient shading for the sectors
    c->setSectorStyle(Chart::LocalGradientShading);

    // Set sector border color to same as fill color. Set label join line color to white (ffffff)
    c->setLineColor(Chart::SameAsMainColor, 0xffffff);

    // Use the side label layout method, with the labels positioned 16 pixels from the donut
    // bounding box
    c->setLabelLayout(Chart::SideLayout, 16);

    // Set the sector label format. The label consists of two lines. The first line is the sector
    // name in Times Bold Italic font and is underlined. The second line shows the data value and
    // percentage.
    c->setLabelFormat(
        "<*block,halign=left*><*font=Times New Roman Bold Italic,size=12,underline=1*>{label}"
        "<*/font*><*br*>US$ {value}K ({percent}%)");

    // Set the label box background color the same as the sector color. Use soft lighting effect
    // with light direction from right. Use rounded corners.
    TextBox* t = c->setLabelStyle();
    t->setBackground(Chart::SameAsMainColor, Chart::Transparent, Chart::softLighting(Chart::Right));
    t->setRoundedCorners();

    // Output the chart
    c->makeChart("threeddonut.png");

    //free up resources
    delete c;

    return 0;
}
© 2023 Advanced Software Engineering Limited. All rights reserved.