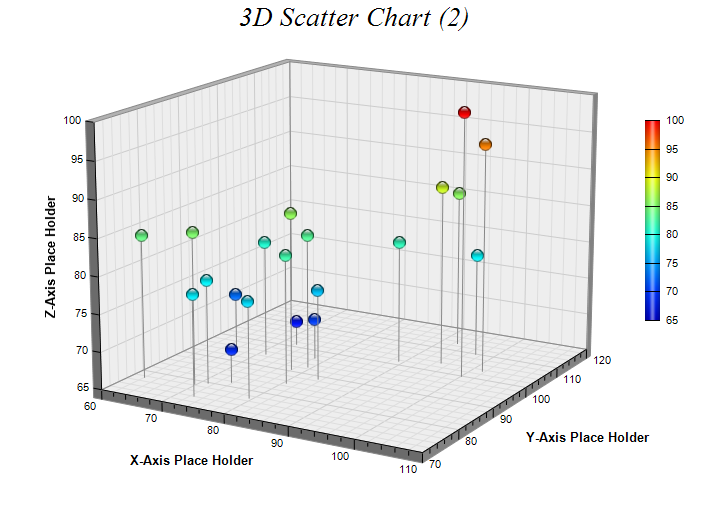
This example extends the
3D Scatter Chart (1) example by including drop lines, using alternative view angles and continuous coloring.
Drop lines are lines that drop from the data points to the XY plane. They help to visualize the "height" (the z-coordinate) of the points and can be useful if there are not too many data points.
The following is the command line version of the code in "cppdemo/threedscatter2". The MFC version of the code is in "mfcdemo/mfcdemo". The Qt Widgets version of the code is in "qtdemo/qtdemo". The QML/Qt Quick version of the code is in "qmldemo/qmldemo".
#include "chartdir.h"

int main(int argc, char *argv[])
{
    // The XYZ data for the 3D scatter chart as 3 random data series
    RanSeries* r = new RanSeries(3);
    DoubleArray xData = r->getSeries(20, 100, -10, 10);
    DoubleArray yData = r->getSeries(20, 100, -10, 10);
    DoubleArray zData = r->getSeries(20, 100, -10, 10);

    // Create a ThreeDScatterChart object of size 720 x 520 pixels
    ThreeDScatterChart* c = new ThreeDScatterChart(720, 520);

    // Add a title to the chart using 20 points Times New Roman Italic font
    c->addTitle("3D Scatter Chart (2)  ", "Times New Roman Italic", 20);

    // Set the center of the plot region at (350, 240), and set width x depth x height to 360 x 360
    // x 270 pixels
    c->setPlotRegion(350, 240, 360, 360, 270);

    // Set the elevation and rotation angles to 15 and 30 degrees
    c->setViewAngle(15, 30);

    // Add a scatter group to the chart using 13 pixels glass sphere symbols, in which the color
    // depends on the z value of the symbol
    ThreeDScatterGroup* g = c->addScatterGroup(xData, yData, zData, "", Chart::GlassSphere2Shape,
        13, Chart::SameAsMainColor);

    // Add grey (888888) drop lines to the symbols
    g->setDropLine(0x888888);

    // Add a color axis (the legend) in which the left center is anchored at (645, 220). Set the
    // length to 200 pixels and the labels on the right side. Use smooth gradient coloring.
    c->setColorAxis(645, 220, Chart::Left, 200, Chart::Right)->setColorGradient();

    // Set the x, y and z axis titles using 10 points Arial Bold font
    c->xAxis()->setTitle("X-Axis Place Holder", "Arial Bold", 10);
    c->yAxis()->setTitle("Y-Axis Place Holder", "Arial Bold", 10);
    c->zAxis()->setTitle("Z-Axis Place Holder", "Arial Bold", 10);

    // Output the chart
    c->makeChart("threedscatter2.png");

    //free up resources
    delete r;
    delete c;

    return 0;
}
© 2023 Advanced Software Engineering Limited. All rights reserved.