[MFC version] mfcdemo/ViewPortControlDemoDlg.cpp
// viewportcontroldemoDlg.cpp : implementation file
//
#include "stdafx.h"
#include "resource.h"
#include "viewportcontroldemoDlg.h"
#include "chartdir.h"
#include <math.h>
#include <vector>
#include <sstream>
#include <algorithm>
#ifdef _DEBUG
#define new DEBUG_NEW
#endif
//
// Constructor
//
CViewPortControlDemoDlg::CViewPortControlDemoDlg(CWnd* pParent /*=NULL*/)
: CDialog(IDD_VIEWPORTCONTROLDEMO, pParent)
{
m_ranSeries = 0;
}
//
// Destructor
//
CViewPortControlDemoDlg::~CViewPortControlDemoDlg()
{
delete m_ranSeries;
delete m_ViewPortControl.getChart();
delete m_ChartViewer.getChart();
}
void CViewPortControlDemoDlg::DoDataExchange(CDataExchange* pDX)
{
CDialog::DoDataExchange(pDX);
DDX_Control(pDX, IDC_PointerPB, m_PointerPB);
DDX_Control(pDX, IDC_ChartViewer, m_ChartViewer);
DDX_Control(pDX, IDC_ViewPortControl, m_ViewPortControl);
}
BEGIN_MESSAGE_MAP(CViewPortControlDemoDlg, CDialog)
ON_BN_CLICKED(IDC_PointerPB, OnPointerPB)
ON_BN_CLICKED(IDC_ZoomInPB, OnZoomInPB)
ON_BN_CLICKED(IDC_ZoomOutPB, OnZoomOutPB)
ON_BN_CLICKED(IDC_SavePB, OnSavePB)
ON_CONTROL(CVN_ViewPortChanged, IDC_ChartViewer, OnViewPortChanged)
ON_CONTROL(CVN_MouseMovePlotArea, IDC_ChartViewer, OnMouseMovePlotArea)
END_MESSAGE_MAP()
//
// Initialization
//
BOOL CViewPortControlDemoDlg::OnInitDialog()
{
CDialog::OnInitDialog();
// Load icons to mouse usage buttons
loadButtonIcon(IDC_PointerPB, IDI_PointerPB, 100, 20);
loadButtonIcon(IDC_ZoomInPB, IDI_ZoomInPB, 100, 20);
loadButtonIcon(IDC_ZoomOutPB, IDI_ZoomOutPB, 100, 20);
loadButtonIcon(IDC_SavePB, IDI_SavePB, 100, 20);
// Load the data
loadData();
// Initialize the CChartViewer
initChartViewer(&m_ChartViewer);
// Trigger the ViewPortChanged event to draw the chart
m_ChartViewer.updateViewPort(true, true);
// Draw and display the full chart in the CViewPortControl
drawFullChart(&m_ViewPortControl, &m_ChartViewer);
// Bind the CChartViewer to the CViewPortControl
m_ViewPortControl.setViewer(&m_ChartViewer);
return TRUE;
}
//
// User clicks on the Pointer pushbutton
//
void CViewPortControlDemoDlg::OnPointerPB()
{
m_ChartViewer.setMouseUsage(Chart::MouseUsageScroll);
}
//
// User clicks on the Zoom In pushbutton
//
void CViewPortControlDemoDlg::OnZoomInPB()
{
m_ChartViewer.setMouseUsage(Chart::MouseUsageZoomIn);
}
//
// User clicks on the Zoom Out pushbutton
//
void CViewPortControlDemoDlg::OnZoomOutPB()
{
m_ChartViewer.setMouseUsage(Chart::MouseUsageZoomOut);
}
//
// User clicks on the Save pushbutton
//
void CViewPortControlDemoDlg::OnSavePB()
{
// Supported formats = PNG, JPG, GIF, BMP, SVG and PDF
TCHAR szFilters[]= _T("PNG (*.png)|*.png|JPG (*.jpg)|*.jpg|GIF (*.gif)|*.gif|")
_T("BMP (*.bmp)|*.bmp|SVG (*.svg)|*.svg|PDF (*.pdf)|*.pdf||");
// The standard CFileDialog
CFileDialog fileDlg(FALSE, _T("png"), _T("chartdirector_demo"), OFN_HIDEREADONLY |
OFN_OVERWRITEPROMPT, szFilters);
if(fileDlg.DoModal() != IDOK)
return;
// Save the chart
CString path = fileDlg.GetPathName();
BaseChart *c = m_ChartViewer.getChart();
if (0 != c)
c->makeChart(TCHARtoUTF8(path));
}
//
// The ViewPortChanged event handler. This event occurs if the user scrolls or zooms in or
// out the chart by dragging or clicking on the chart. It can also be triggered by calling
// CChartViewer.updateViewPort.
//
void CViewPortControlDemoDlg::OnViewPortChanged()
{
// Update the chart if necessary
if (m_ChartViewer.needUpdateChart())
drawChart(&m_ChartViewer);
}
//
// Draw track cursor when mouse is moving over plotarea
//
void CViewPortControlDemoDlg::OnMouseMovePlotArea()
{
trackLineLegend((XYChart *)m_ChartViewer.getChart(), m_ChartViewer.getPlotAreaMouseX());
m_ChartViewer.updateDisplay();
}
//
// Load the data
//
void CViewPortControlDemoDlg::loadData()
{
// In this example, we just use random numbers as data.
m_ranSeries = new RanSeries(127);
m_timeStamps = m_ranSeries->getDateSeries(1827, Chart::chartTime(2010, 1, 1), 86400);
m_dataSeriesA = m_ranSeries->getSeries(1827, 150, -10, 10);
m_dataSeriesB = m_ranSeries->getSeries(1827, 200, -10, 10);
m_dataSeriesC = m_ranSeries->getSeries(1827, 250, -8, 8);
}
//
// Initialize the CChartViewer
//
void CViewPortControlDemoDlg::initChartViewer(CChartViewer *viewer)
{
// Set the full x range to be the duration of the data
viewer->setFullRange("x", m_timeStamps[0], m_timeStamps[m_timeStamps.len - 1]);
// Initialize the view port to show the latest 20% of the time range
viewer->setViewPortWidth(0.2);
viewer->setViewPortLeft(1 - viewer->getViewPortWidth());
// Set the maximum zoom to 10 points
viewer->setZoomInWidthLimit(10.0 / m_timeStamps.len);
// Initially set the mouse to drag to scroll mode.
m_PointerPB.SetCheck(1);
viewer->setMouseUsage(Chart::MouseUsageScroll);
// Enable mouse wheel zooming by setting the zoom ratio to 1.1 per wheel event
viewer->setMouseWheelZoomRatio(1.1);
}
//
// Draw the chart and display it in the given viewer
//
void CViewPortControlDemoDlg::drawChart(CChartViewer *viewer)
{
// Get the start date and end date that are visible on the chart.
double viewPortStartDate = viewer->getValueAtViewPort("x", viewer->getViewPortLeft());
double viewPortEndDate = viewer->getValueAtViewPort("x", viewer->getViewPortLeft() +
viewer->getViewPortWidth());
// Get the array indexes that corresponds to the visible start and end dates
int startIndex = (int)floor(Chart::bSearch(m_timeStamps, viewPortStartDate));
int endIndex = (int)ceil(Chart::bSearch(m_timeStamps, viewPortEndDate));
int noOfPoints = endIndex - startIndex + 1;
// Extract the part of the data array that are visible.
DoubleArray viewPortTimeStamps = DoubleArray(m_timeStamps.data + startIndex, noOfPoints);
DoubleArray viewPortDataSeriesA = DoubleArray(m_dataSeriesA.data + startIndex, noOfPoints);
DoubleArray viewPortDataSeriesB = DoubleArray(m_dataSeriesB.data + startIndex, noOfPoints);
DoubleArray viewPortDataSeriesC = DoubleArray(m_dataSeriesC.data + startIndex, noOfPoints);
//
// At this stage, we have extracted the visible data. We can use those data to plot the chart.
//
///////////////////////////////////////////////////////////////////////////////////////
// Configure overall chart appearance.
///////////////////////////////////////////////////////////////////////////////////////
// Create an XYChart object of size 640 x 400 pixels
XYChart *c = new XYChart(640, 400);
// Set the plotarea at (55, 55) with width 80 pixels less than chart width, and height 92 pixels
// less than chart height. Use a vertical gradient from light blue (f0f6ff) to sky blue (a0c0ff)
// as background. Set border to transparent and grid lines to white (ffffff).
c->setPlotArea(55, 55, c->getWidth() - 80, c->getHeight() - 92, c->linearGradientColor(0, 55, 0,
c->getHeight() - 35, 0xf0f6ff, 0xa0c0ff), -1, Chart::Transparent, 0xffffff, 0xffffff);
// As the data can lie outside the plotarea in a zoomed chart, we need enable clipping.
c->setClipping();
// Add a title box using dark grey (0x333333) 15pt Arial Bold font
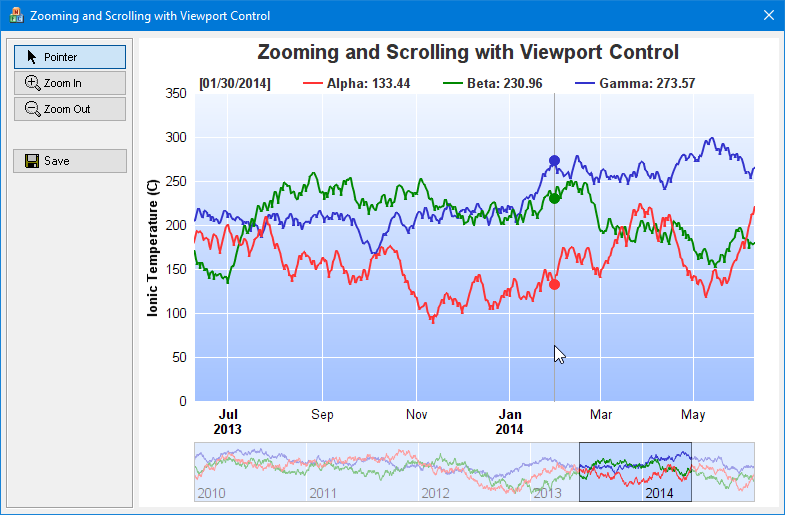
c->addTitle(" Zooming and Scrolling with Viewport Control", "Arial Bold", 15, 0x333333);
// Set legend icon style to use line style icon, sized for 10pt font
c->getLegend()->setLineStyleKey();
c->getLegend()->setFontSize(10);
// Set the x and y axis stems to transparent and the label font to 10pt Arial
c->xAxis()->setColors(Chart::Transparent);
c->yAxis()->setColors(Chart::Transparent);
c->xAxis()->setLabelStyle("Arial", 10);
c->yAxis()->setLabelStyle("Arial", 10);
// Add axis title using 10pt Arial Bold font
c->yAxis()->setTitle("Ionic Temperature (C)", "Arial Bold", 10);
///////////////////////////////////////////////////////////////////////////////////////
// Add data to chart
///////////////////////////////////////////////////////////////////////////////////////
//
// In this example, we represent the data by lines. You may modify the code below to use other
// representations (areas, scatter plot, etc).
//
// Add a line layer for the lines, using a line width of 2 pixels
LineLayer *layer = c->addLineLayer();
layer->setLineWidth(2);
// In this demo, we do not have too many data points. In real code, the chart may contain a lot
// of data points when fully zoomed out - much more than the number of horizontal pixels in this
// plot area. So it is a good idea to use fast line mode.
layer->setFastLineMode();
// Now we add the 3 data series to a line layer, using the color red (0xff3333), green
// (0x008800) and blue (0x3333cc)
layer->setXData(viewPortTimeStamps);
layer->addDataSet(viewPortDataSeriesA, 0xff3333, "Alpha");
layer->addDataSet(viewPortDataSeriesB, 0x008800, "Beta");
layer->addDataSet(viewPortDataSeriesC, 0x3333cc, "Gamma");
///////////////////////////////////////////////////////////////////////////////////////
// Configure axis scale and labelling
///////////////////////////////////////////////////////////////////////////////////////
// Set the x-axis as a date/time axis with the scale according to the view port x range.
viewer->syncDateAxisWithViewPort("x", c->xAxis());
// For the automatic y-axis labels, set the minimum spacing to 30 pixels.
c->yAxis()->setTickDensity(30);
//
// In this demo, the time range can be from a few years to a few days. We demonstrate how to
// set up different date/time format based on the time range.
//
// If all ticks are yearly aligned, then we use "yyyy" as the label format.
c->xAxis()->setFormatCondition("align", 360 * 86400);
c->xAxis()->setLabelFormat("{value|yyyy}");
// If all ticks are monthly aligned, then we use "mmm yyyy" in bold font as the first
// label of a year, and "mmm" for other labels.
c->xAxis()->setFormatCondition("align", 30 * 86400);
c->xAxis()->setMultiFormat(Chart::StartOfYearFilter(), "<*font=bold*>{value|mmm<*br*>yyyy}",
Chart::AllPassFilter(), "{value|mmm}");
// If all ticks are daily algined, then we use "mmm dd<*br*>yyyy" in bold font as the
// first label of a year, and "mmm dd" in bold font as the first label of a month, and
// "dd" for other labels.
c->xAxis()->setFormatCondition("align", 86400);
c->xAxis()->setMultiFormat(Chart::StartOfYearFilter(),
"<*block,halign=left*><*font=bold*>{value|mmm dd<*br*>yyyy}",
Chart::StartOfMonthFilter(), "<*font=bold*>{value|mmm dd}");
c->xAxis()->setMultiFormat(Chart::AllPassFilter(), "{value|dd}");
// For all other cases (sub-daily ticks), use "hh:nn<*br*>mmm dd" for the first label of
// a day, and "hh:nn" for other labels.
c->xAxis()->setFormatCondition("else");
c->xAxis()->setMultiFormat(Chart::StartOfDayFilter(), "<*font=bold*>{value|hh:nn<*br*>mmm dd}",
Chart::AllPassFilter(), "{value|hh:nn}");
///////////////////////////////////////////////////////////////////////////////////////
// Output the chart
///////////////////////////////////////////////////////////////////////////////////////
// We need to update the track line too. If the mouse is moving on the chart (eg. if
// the user drags the mouse on the chart to scroll it), the track line will be updated
// in the MouseMovePlotArea event. Otherwise, we need to update the track line here.
if (!viewer->isInMouseMoveEvent())
{
trackLineLegend(c, (0 == viewer->getChart()) ? c->getPlotArea()->getRightX() :
viewer->getPlotAreaMouseX());
}
delete viewer->getChart();
viewer->setChart(c);
}
//
// Draw the full thumbnail chart and display it in the given CViewPortControl
//
void CViewPortControlDemoDlg::drawFullChart(CViewPortControl *vpc, CChartViewer *viewer)
{
// Create an XYChart object of size 640 x 70 pixels
XYChart *c = new XYChart(640, 70);
// Set the plotarea with the same horizontal position as that in the main chart for alignment.
c->setPlotArea(55, 5, c->getWidth() - 80, c->getHeight() - 11, 0xc0d8ff, -1, 0x888888,
Chart::Transparent, 0xffffff);
// Set the x axis stem to transparent and the label font to 10pt Arial
c->xAxis()->setColors(Chart::Transparent);
c->xAxis()->setLabelStyle("Arial", 10);
// Put the x-axis labels inside the plot area by setting a negative label gap. Use
// setLabelAlignment to put the label at the right side of the tick.
c->xAxis()->setLabelGap(-1);
c->xAxis()->setLabelAlignment(1);
// Set the y axis stem and labels to transparent (that is, hide the labels)
c->yAxis()->setColors(Chart::Transparent, Chart::Transparent);
// Add a line layer for the lines with fast line mode enabled
LineLayer *layer = c->addLineLayer();
layer->setFastLineMode();
// Now we add the 3 data series to a line layer, using the color red (0xff3333), green
// (0x008800) and blue (0x3333cc)
layer->setXData(m_timeStamps);
layer->addDataSet(m_dataSeriesA, 0xff3333);
layer->addDataSet(m_dataSeriesB, 0x008800);
layer->addDataSet(m_dataSeriesC, 0x3333cc);
// The x axis scales should reflect the full range of the view port
c->xAxis()->setDateScale(viewer->getValueAtViewPort("x", 0), viewer->getValueAtViewPort("x", 1));
// For the automatic x-axis labels, set the minimum spacing to 75 pixels.
c->xAxis()->setTickDensity(75);
// For the auto-scaled y-axis, as we hide the labels, we can disable axis rounding. This can
// make the axis scale fit the data tighter.
c->yAxis()->setRounding(false, false);
// Output the chart
vpc->setChart(c);
}
//
// Draw the track line with legend
//
void CViewPortControlDemoDlg::trackLineLegend(XYChart *c, int mouseX)
{
// Clear the current dynamic layer and get the DrawArea object to draw on it.
DrawArea *d = c->initDynamicLayer();
// The plot area object
PlotArea *plotArea = c->getPlotArea();
// Get the data x-value that is nearest to the mouse, and find its pixel coordinate.
double xValue = c->getNearestXValue(mouseX);
int xCoor = c->getXCoor(xValue);
// Draw a vertical track line at the x-position
d->vline(plotArea->getTopY(), plotArea->getBottomY(), xCoor, 0xaaaaaa);
// Container to hold the legend entries
std::vector<std::string> legendEntries;
// Iterate through all layers to build the legend array
for (int i = 0; i < c->getLayerCount(); ++i) {
Layer *layer = c->getLayerByZ(i);
// The data array index of the x-value
int xIndex = layer->getXIndexOf(xValue);
// Iterate through all the data sets in the layer
for (int j = 0; j < layer->getDataSetCount(); ++j) {
DataSet *dataSet = layer->getDataSetByZ(j);
// We are only interested in visible data sets with names
const char *dataName = dataSet->getDataName();
int color = dataSet->getDataColor();
if (dataName && *dataName && (color != Chart::Transparent)) {
// Build the legend entry, consist of the legend icon, name and data value.
double dataValue = dataSet->getValue(xIndex);
std::ostringstream legendEntry;
legendEntry << "<*block*>" << dataSet->getLegendIcon() << " " << dataName << ": " <<
((dataValue == Chart::NoValue) ? "N/A" : c->formatValue(dataValue, "{value|P4}"))
<< "<*/*>";
legendEntries.push_back(legendEntry.str());
// Draw a track dot for data points within the plot area
int yCoor = c->getYCoor(dataSet->getPosition(xIndex), dataSet->getUseYAxis());
if ((yCoor >= plotArea->getTopY()) && (yCoor <= plotArea->getBottomY())) {
d->circle(xCoor, yCoor, 5, 5, color, color);
}
}
}
}
// Create the legend by joining the legend entries
std::ostringstream legendText;
legendText << "<*block,maxWidth=" << plotArea->getWidth() << "*><*block*><*font=Arial Bold*>["
<< c->xAxis()->getFormattedLabel(xValue, "mm/dd/yyyy") << "]<*/*>";
for (int i = ((int)legendEntries.size()) - 1; i >= 0; --i)
legendText << " " << legendEntries[i];
// Display the legend on the top of the plot area
TTFText *t = d->text(legendText.str().c_str(), "Arial Bold", 10);
t->draw(plotArea->getLeftX() + 5, plotArea->getTopY() - 3, 0x333333, Chart::BottomLeft);
t->destroy();
}
/////////////////////////////////////////////////////////////////////////////
// General utilities
//
// Load an icon resource into a button
//
void CViewPortControlDemoDlg::loadButtonIcon(int buttonId, int iconId, int width, int height)
{
GetDlgItem(buttonId)->SendMessage(BM_SETIMAGE, IMAGE_ICON, (LPARAM)::LoadImage(
AfxGetResourceHandle(), MAKEINTRESOURCE(iconId), IMAGE_ICON, width, height,
LR_DEFAULTCOLOR));
}
© 2023 Advanced Software Engineering Limited. All rights reserved.