[MFC version] mfcdemo/ZoomScrollTrack2Dlg.cpp
// CZoomScrollTrack2Dlg.cpp : implementation file
//
#include "stdafx.h"
#include "resource.h"
#include "ZoomScrollTrack2Dlg.h"
#include "chartdir.h"
#include <math.h>
#include <sstream>
#include <algorithm>
#ifdef _DEBUG
#define new DEBUG_NEW
#endif
//
// Constructor
//
CZoomScrollTrack2Dlg::CZoomScrollTrack2Dlg(CWnd* pParent /*=NULL*/)
: CDialog(IDD_ZOOMSCROLLTRACK2, pParent)
{
m_ranSeries = 0;
}
//
// Destructor
//
CZoomScrollTrack2Dlg::~CZoomScrollTrack2Dlg()
{
delete m_ranSeries;
delete m_ChartViewer.getChart();
}
void CZoomScrollTrack2Dlg::DoDataExchange(CDataExchange* pDX)
{
CDialog::DoDataExchange(pDX);
DDX_Control(pDX, IDC_PointerPB, m_PointerPB);
DDX_Control(pDX, IDC_STARTDATE, m_StartDate);
DDX_Control(pDX, IDC_ENDDATE, m_EndDate);
DDX_Control(pDX, IDC_HScrollBar, m_HScrollBar);
DDX_Control(pDX, IDC_ChartViewer, m_ChartViewer);
DDX_Control(pDX, IDC_ALPHA_CB, m_AlphaCB);
DDX_Control(pDX, IDC_BETA_CB, m_BetaCB);
DDX_Control(pDX, IDC_GAMMA_CB, m_GammaCB);
}
BEGIN_MESSAGE_MAP(CZoomScrollTrack2Dlg, CDialog)
ON_WM_DESTROY()
ON_BN_CLICKED(IDC_PointerPB, OnPointerPB)
ON_BN_CLICKED(IDC_ZoomInPB, OnZoomInPB)
ON_BN_CLICKED(IDC_ZoomOutPB, OnZoomOutPB)
ON_BN_CLICKED(IDC_ALPHA_CB, OnClickCheckBox)
ON_BN_CLICKED(IDC_BETA_CB, OnClickCheckBox)
ON_BN_CLICKED(IDC_GAMMA_CB, OnClickCheckBox)
ON_NOTIFY(DTN_DATETIMECHANGE, IDC_STARTDATE, OnStartDateChanged)
ON_NOTIFY(DTN_DATETIMECHANGE, IDC_ENDDATE, OnEndDateChanged)
ON_WM_HSCROLL()
ON_CONTROL(CVN_ViewPortChanged, IDC_ChartViewer, OnViewPortChanged)
ON_CONTROL(CVN_MouseMovePlotArea, IDC_ChartViewer, OnMouseMovePlotArea)
END_MESSAGE_MAP()
/////////////////////////////////////////////////////////////////////////////
// CZoomScrollTrack2Dlg message handlers
//
// Initialization
//
BOOL CZoomScrollTrack2Dlg::OnInitDialog()
{
CDialog::OnInitDialog();
// Load icons to mouse usage buttons
loadButtonIcon(IDC_PointerPB, IDI_PointerPB, 100, 20);
loadButtonIcon(IDC_ZoomInPB, IDI_ZoomInPB, 100, 20);
loadButtonIcon(IDC_ZoomOutPB, IDI_ZoomOutPB, 100, 20);
// Load the data
loadData();
// Initialize the CChartViewer
initChartViewer(&m_ChartViewer);
// Enable all data series
m_AlphaCB.SetCheck(BST_CHECKED);
m_BetaCB.SetCheck(BST_CHECKED);
m_GammaCB.SetCheck(BST_CHECKED);
// Trigger the ViewPortChanged event to draw the chart
m_ChartViewer.updateViewPort(true, true);
return TRUE;
}
//
// User clicks on the Pointer pushbutton
//
void CZoomScrollTrack2Dlg::OnPointerPB()
{
m_ChartViewer.setMouseUsage(Chart::MouseUsageScroll);
}
//
// User clicks on the Zoom In pushbutton
//
void CZoomScrollTrack2Dlg::OnZoomInPB()
{
m_ChartViewer.setMouseUsage(Chart::MouseUsageZoomIn);
}
//
// User clicks on the Zoom Out pushbutton
//
void CZoomScrollTrack2Dlg::OnZoomOutPB()
{
m_ChartViewer.setMouseUsage(Chart::MouseUsageZoomOut);
}
//
// User clicks on Alpha, Beta or Gamma checkboxes
//
void CZoomScrollTrack2Dlg::OnClickCheckBox()
{
m_ChartViewer.updateViewPort(true, true);
}
//
// The ViewPortChanged event handler. This event occurs if the user scrolls or zooms in or
// out the chart by dragging or clicking on the chart. It can also be triggered by calling
// CChartViewer.updateViewPort.
//
void CZoomScrollTrack2Dlg::OnViewPortChanged()
{
// In addition to updating the chart, we may also need to update other controls that
// changes based on the view port.
updateControls(&m_ChartViewer);
// Update the chart if necessary
if (m_ChartViewer.needUpdateChart())
drawChart(&m_ChartViewer);
}
//
// User selects a start date from the CDateTimeCtrl control
//
void CZoomScrollTrack2Dlg::OnStartDateChanged(NMHDR* pNMHDR, LRESULT* pResult)
{
// Get the selected date
SYSTEMTIME t;
m_StartDate.GetTime(&t);
double startDate = Chart::chartTime(t.wYear, t.wMonth, t.wDay);
// The updated view port width
double vpWidth = m_ChartViewer.getViewPortRight() -
m_ChartViewer.getViewPortAtValue("x", startDate);
// Make sure the updated view port width is within bounds
vpWidth = (std::max)(m_ChartViewer.getZoomInWidthLimit(), (std::min)(vpWidth,
m_ChartViewer.getViewPortLeft() + m_ChartViewer.getViewPortWidth()));
// Update view port and trigger a view port changed event to update the chart
m_ChartViewer.setViewPortLeft(m_ChartViewer.getViewPortRight() - vpWidth);
m_ChartViewer.setViewPortWidth(vpWidth);
m_ChartViewer.updateViewPort(true, false);
*pResult = 0;
}
//
// User selects an end date from the CDateTimeCtrl control
//
void CZoomScrollTrack2Dlg::OnEndDateChanged(NMHDR* pNMHDR, LRESULT* pResult)
{
// Get the selected date
SYSTEMTIME t;
m_EndDate.GetTime(&t);
double endDate = Chart::chartTime(t.wYear, t.wMonth, t.wDay);
// The updated view port width
double vpWidth = m_ChartViewer.getViewPortAtValue("x", endDate) -
m_ChartViewer.getViewPortLeft();
// Make sure the updated view port width is within bounds
vpWidth = (std::max)(m_ChartViewer.getZoomInWidthLimit(), (std::min)(vpWidth,
1 - m_ChartViewer.getViewPortLeft()));
// Update view port and trigger a view port changed event to update the chart
m_ChartViewer.setViewPortWidth(vpWidth);
m_ChartViewer.updateViewPort(true, false);
*pResult = 0;
}
//
// User clicks on the the horizontal scroll bar
//
void CZoomScrollTrack2Dlg::OnHScroll(UINT nSBCode, UINT nPos, CScrollBar* pScrollBar)
{
double newViewPortLeft = moveScrollBar(nSBCode, nPos, pScrollBar);
// Update the view port if the scroll bar has really moved
if (newViewPortLeft != m_ChartViewer.getViewPortLeft())
{
m_ChartViewer.setViewPortLeft(moveScrollBar(nSBCode, nPos, pScrollBar));
m_ChartViewer.updateViewPort(true, false);
}
}
//
// Draw track cursor when mouse is moving over plotarea
//
void CZoomScrollTrack2Dlg::OnMouseMovePlotArea()
{
trackLineLabel((XYChart *)m_ChartViewer.getChart(), m_ChartViewer.getPlotAreaMouseX());
m_ChartViewer.updateDisplay();
// Hide the track cursor when the mouse leaves the plot area
m_ChartViewer.removeDynamicLayer(CVN_MouseLeavePlotArea);
}
//
// Load the data
//
void CZoomScrollTrack2Dlg::loadData()
{
// In this example, we just use random numbers as data.
m_ranSeries = new RanSeries(127);
m_timeStamps = m_ranSeries->getDateSeries(1827, Chart::chartTime(2015, 1, 1), 86400);
m_dataSeriesA = m_ranSeries->getSeries(1827, 150, -10, 10);
m_dataSeriesB = m_ranSeries->getSeries(1827, 200, -10, 10);
m_dataSeriesC = m_ranSeries->getSeries(1827, 250, -8, 8);
}
//
// Initialize the CChartViewer
//
void CZoomScrollTrack2Dlg::initChartViewer(CChartViewer *viewer)
{
// Set the full x range to be the duration of the data
viewer->setFullRange("x", m_timeStamps[0], m_timeStamps[m_timeStamps.len - 1]);
// Initialize the view port to show the latest 20% of the time range
viewer->setViewPortWidth(0.2);
viewer->setViewPortLeft(1 - viewer->getViewPortWidth());
// Enable mouse wheel zooming by setting the zoom ratio to 1.1 per wheel event
viewer->setMouseWheelZoomRatio(1.1);
// Set the maximum zoom to 10 points
viewer->setZoomInWidthLimit(10.0 / m_timeStamps.len);
// Initially set the mouse to drag to scroll mode.
m_PointerPB.SetCheck(1);
viewer->setMouseUsage(Chart::MouseUsageScroll);
}
//
// Update other controls that may be affected by the viewport.
//
void CZoomScrollTrack2Dlg::updateControls(CChartViewer *viewer)
{
// Update the start date control to reflect the view port.
double currentStartDate = viewer->getValueAtViewPort("x", viewer->getViewPortLeft());
int startYMD = Chart::getChartYMD(currentStartDate);
int startHMS = (int)fmod(currentStartDate, 86400);
CTime startDate = CTime(startYMD / 10000, (startYMD % 10000) / 100, startYMD % 100,
startHMS / 3600, (startHMS % 3600) / 60, startHMS % 60);
m_StartDate.SetTime(&startDate);
// Update the end date control to reflect the view port.
double currentEndDate = viewer->getValueAtViewPort("x", viewer->getViewPortLeft() +
viewer->getViewPortWidth());
int endYMD = Chart::getChartYMD(currentEndDate);
int endHMS = (int)fmod(currentEndDate, 86400);
CTime endDate = CTime(endYMD / 10000, (endYMD % 10000) / 100, endYMD % 100,
endHMS / 3600, (endHMS % 3600) / 60, endHMS % 60);
m_EndDate.SetTime(&endDate);
// Update the scroll bar to reflect the view port position and width of the view port.
m_HScrollBar.EnableWindow(viewer->getViewPortWidth() < 1);
if (viewer->getViewPortWidth() < 1)
{
SCROLLINFO info;
info.cbSize = sizeof(SCROLLINFO);
info.fMask = SIF_ALL;
info.nMin = 0;
info.nMax = 0x1fffffff;
info.nPage = (int)ceil(viewer->getViewPortWidth() * (info.nMax - info.nMin));
info.nPos = (int)(0.5 + viewer->getViewPortLeft() * (info.nMax - info.nMin)) + info.nMin;
m_HScrollBar.SetScrollInfo(&info);
}
}
//
// Handle scroll bar events
//
double CZoomScrollTrack2Dlg::moveScrollBar(UINT nSBCode, UINT nPos, CScrollBar* pScrollBar)
{
//
// Get current scroll bar position
//
SCROLLINFO info;
info.cbSize = sizeof(SCROLLINFO);
info.fMask = SIF_ALL;
pScrollBar->GetScrollInfo(&info);
//
// Compute new position based on the type of scroll bar events
//
int newPos = info.nPos;
switch (nSBCode)
{
case SB_LEFT:
newPos = info.nMin;
break;
case SB_RIGHT:
newPos = info.nMax;
break;
case SB_LINELEFT:
newPos -= (info.nPage > 10) ? info.nPage / 10 : 1;
break;
case SB_LINERIGHT:
newPos += (info.nPage > 10) ? info.nPage / 10 : 1;
break;
case SB_PAGELEFT:
newPos -= info.nPage;
break;
case SB_PAGERIGHT:
newPos += info.nPage;
break;
case SB_THUMBTRACK:
newPos = info.nTrackPos;
break;
}
if (newPos < info.nMin) newPos = info.nMin;
if (newPos > info.nMax) newPos = info.nMax;
// Update the scroll bar with the new position
pScrollBar->SetScrollPos(newPos);
// Returns the position of the scroll bar as a ratio of its total length
return ((double)(newPos - info.nMin)) / (info.nMax - info.nMin);
}
//
// Draw the chart and display it in the given viewer
//
void CZoomScrollTrack2Dlg::drawChart(CChartViewer *viewer)
{
// Get the start date and end date that are visible on the chart.
double viewPortStartDate = viewer->getValueAtViewPort("x", viewer->getViewPortLeft());
double viewPortEndDate = viewer->getValueAtViewPort("x", viewer->getViewPortLeft() +
viewer->getViewPortWidth());
// Get the array indexes that corresponds to the visible start and end dates
int startIndex = (int)floor(Chart::bSearch(m_timeStamps, viewPortStartDate));
int endIndex = (int)ceil(Chart::bSearch(m_timeStamps, viewPortEndDate));
int noOfPoints = endIndex - startIndex + 1;
// Extract the part of the data array that are visible.
DoubleArray viewPortTimeStamps = DoubleArray(m_timeStamps.data + startIndex, noOfPoints);
DoubleArray viewPortDataSeriesA = DoubleArray(m_dataSeriesA.data + startIndex, noOfPoints);
DoubleArray viewPortDataSeriesB = DoubleArray(m_dataSeriesB.data + startIndex, noOfPoints);
DoubleArray viewPortDataSeriesC = DoubleArray(m_dataSeriesC.data + startIndex, noOfPoints);
//
// At this stage, we have extracted the visible data. We can use those data to plot the chart.
//
///////////////////////////////////////////////////////////////////////////////////////
// Configure overall chart appearance.
///////////////////////////////////////////////////////////////////////////////////////
// Create an XYChart object of size 650 x 350 pixels, with a white (ffffff) background and grey
// (aaaaaa) border
XYChart *c = new XYChart(650, 350, 0xffffff, 0xaaaaaa);
// Set the plotarea at (55, 55) with width 90 pixels less than chart width, and height 90 pixels
// less than chart height. Use a vertical gradient from light blue (f0f6ff) to sky blue (a0c0ff)
// as background. Set border to transparent and grid lines to white (ffffff).
c->setPlotArea(55, 55, c->getWidth() - 90, c->getHeight() - 90, c->linearGradientColor(0, 55, 0,
c->getHeight() - 35, 0xf0f6ff, 0xa0c0ff), -1, Chart::Transparent, 0xffffff, 0xffffff);
// As the data can lie outside the plotarea in a zoomed chart, we need enable clipping.
c->setClipping();
// Add a title to the chart using 18 pts Times New Roman Bold Italic font
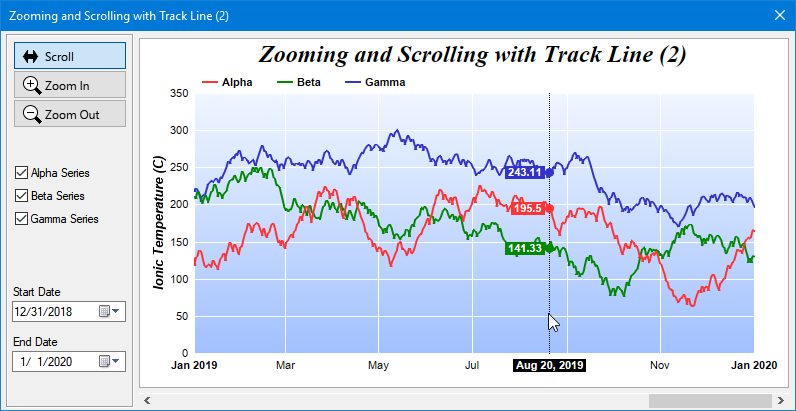
c->addTitle(" Zooming and Scrolling with Track Line (2)", "Times New Roman Bold Italic", 18);
// Add a legend box at (55, 30) using horizontal layout. Use 8pts Arial Bold as font. Set the
// background and border color to Transparent and use line style legend key.
LegendBox *b = c->addLegend(55, 30, false, "Arial Bold", 8);
b->setBackground(Chart::Transparent);
b->setLineStyleKey();
// Set the axis stem to transparent
c->xAxis()->setColors(Chart::Transparent);
c->yAxis()->setColors(Chart::Transparent);
// Add axis title using 10pts Arial Bold Italic font
c->yAxis()->setTitle("Ionic Temperature (C)", "Arial Bold Italic", 10);
///////////////////////////////////////////////////////////////////////////////////////
// Add data to chart
///////////////////////////////////////////////////////////////////////////////////////
//
// In this example, we represent the data by lines. You may modify the code below to use other
// representations (areas, scatter plot, etc).
//
// Add a line layer for the lines, using a line width of 2 pixels
LineLayer *layer = c->addLineLayer();
layer->setLineWidth(2);
// In this demo, we do not have too many data points. In real code, the chart may contain a lot
// of data points when fully zoomed out - much more than the number of horizontal pixels in this
// plot area. So it is a good idea to use fast line mode.
layer->setFastLineMode();
// Now we add the 3 data series to a line layer, using the color red (ff0000), green (00cc00)
// and blue (0000ff)
layer->setXData(viewPortTimeStamps);
if (m_AlphaCB.GetCheck())
layer->addDataSet(viewPortDataSeriesA, 0xff3333, "Alpha");
if (m_BetaCB.GetCheck())
layer->addDataSet(viewPortDataSeriesB, 0x008800, "Beta");
if (m_GammaCB.GetCheck())
layer->addDataSet(viewPortDataSeriesC, 0x3333CC, "Gamma");
///////////////////////////////////////////////////////////////////////////////////////
// Configure axis scale and labelling
///////////////////////////////////////////////////////////////////////////////////////
// Set the x-axis as a date/time axis with the scale according to the view port x range.
viewer->syncDateAxisWithViewPort("x", c->xAxis());
//
// In this demo, the time range can be from a few years to a few days. We demonstrate
// how to set up different date/time format based on the time range.
//
// If all ticks are yearly aligned, then we use "yyyy" as the label format.
c->xAxis()->setFormatCondition("align", 360 * 86400);
c->xAxis()->setLabelFormat("{value|yyyy}");
// If all ticks are monthly aligned, then we use "mmm yyyy" in bold font as the first
// label of a year, and "mmm" for other labels.
c->xAxis()->setFormatCondition("align", 30 * 86400);
c->xAxis()->setMultiFormat(Chart::StartOfYearFilter(), "<*font=bold*>{value|mmm yyyy}",
Chart::AllPassFilter(), "{value|mmm}");
// If all ticks are daily algined, then we use "mmm dd<*br*>yyyy" in bold font as the
// first label of a year, and "mmm dd" in bold font as the first label of a month, and
// "dd" for other labels. (86400 = number of seconds in one day)
c->xAxis()->setFormatCondition("align", 86400);
c->xAxis()->setMultiFormat(Chart::StartOfYearFilter(),
"<*block,halign=left*><*font=bold*>{value|mmm dd<*br*>yyyy}",
Chart::StartOfMonthFilter(), "<*font=bold*>{value|mmm dd}");
c->xAxis()->setMultiFormat(Chart::AllPassFilter(), "{value|dd}");
// For all other cases (sub-daily ticks), use "hh:nn<*br*>mmm dd" for the first label of
// a day, and "hh:nn" for other labels.
c->xAxis()->setFormatCondition("else");
c->xAxis()->setMultiFormat(Chart::StartOfDayFilter(),
"<*font=bold*>{value|hh:nn<*br*>mmm dd}", Chart::AllPassFilter(), "{value|hh:nn}");
///////////////////////////////////////////////////////////////////////////////////////
// Output the chart
///////////////////////////////////////////////////////////////////////////////////////
// We need to update the track line too. If the mouse is moving on the chart (eg. if
// the user drags the mouse on the chart to scroll it), the track line will be updated
// in the MouseMovePlotArea event. Otherwise, we need to update the track line here.
if ((!viewer->isInMouseMoveEvent()) && viewer->isMouseOnPlotArea())
trackLineLabel(c, viewer->getPlotAreaMouseX());
delete viewer->getChart();
viewer->setChart(c);
}
//
// Draw track line with data labels
//
void CZoomScrollTrack2Dlg::trackLineLabel(XYChart *c, int mouseX)
{
// Clear the current dynamic layer and get the DrawArea object to draw on it.
DrawArea *d = c->initDynamicLayer();
// The plot area object
PlotArea *plotArea = c->getPlotArea();
// Get the data x-value that is nearest to the mouse, and find its pixel coordinate.
double xValue = c->getNearestXValue(mouseX);
if (xValue == Chart::NoValue) // No data in chart
return;
int xCoor = c->getXCoor(xValue);
// Draw a vertical track line at the x-position
d->vline(plotArea->getTopY(), plotArea->getBottomY(), xCoor,
d->dashLineColor(0x000000, 0x0101));
// Draw a label on the x-axis to show the track line position.
std::ostringstream xlabel;
xlabel << "<*font,bgColor=000000*> " << c->xAxis()->getFormattedLabel(xValue, "mmm dd, yyyy")
<< " <*/font*>";
TTFText *t = d->text(xlabel.str().c_str(), "Arial Bold", 8);
// Restrict the x-pixel position of the label to make sure it stays inside the chart image.
int xLabelPos = (std::max)(0, (std::min)(xCoor - t->getWidth() / 2, c->getWidth() - t->getWidth()));
t->draw(xLabelPos, plotArea->getBottomY() + 6, 0xffffff);
t->destroy();
// Iterate through all layers to draw the data labels
for (int i = 0; i < c->getLayerCount(); ++i) {
Layer *layer = c->getLayerByZ(i);
// The data array index of the x-value
int xIndex = layer->getXIndexOf(xValue);
// Iterate through all the data sets in the layer
for (int j = 0; j < layer->getDataSetCount(); ++j)
{
DataSet *dataSet = layer->getDataSetByZ(j);
const char *dataSetName = dataSet->getDataName();
// Get the color, name and position of the data label
int color = dataSet->getDataColor();
int yCoor = c->getYCoor(dataSet->getPosition(xIndex), dataSet->getUseYAxis());
// Draw a track dot with a label next to it for visible data points in the plot area
if ((yCoor >= plotArea->getTopY()) && (yCoor <= plotArea->getBottomY()) && (color !=
Chart::Transparent) && dataSetName && *dataSetName)
{
d->circle(xCoor, yCoor, 4, 4, color, color);
std::ostringstream label;
label << "<*font,bgColor=" << std::hex << color << "*> "
<< c->formatValue(dataSet->getValue(xIndex), "{value|P4}") << " <*font*>";
t = d->text(label.str().c_str(), "Arial Bold", 8);
// Draw the label on the right side of the dot if the mouse is on the left side the
// chart, and vice versa. This ensures the label will not go outside the chart image.
if (xCoor <= (plotArea->getLeftX() + plotArea->getRightX()) / 2)
t->draw(xCoor + 5, yCoor, 0xffffff, Chart::Left);
else
t->draw(xCoor - 5, yCoor, 0xffffff, Chart::Right);
t->destroy();
}
}
}
}
/////////////////////////////////////////////////////////////////////////////
// General utilities
//
// Load an icon resource into a button
//
void CZoomScrollTrack2Dlg::loadButtonIcon(int buttonId, int iconId, int width, int height)
{
// Resize the icon to match the screen DPI for high DPI support
HDC screen = ::GetDC(0);
double scaleFactor = GetDeviceCaps(screen, LOGPIXELSX) / 96.0;
::ReleaseDC(0, screen);
width = (int)(width * scaleFactor + 0.5);
height = (int)(height * scaleFactor + 0.5);
GetDlgItem(buttonId)->SendMessage(BM_SETIMAGE, IMAGE_ICON, (LPARAM)::LoadImage(
AfxGetResourceHandle(), MAKEINTRESOURCE(iconId), IMAGE_ICON, width, height, LR_DEFAULTCOLOR));
}
© 2023 Advanced Software Engineering Limited. All rights reserved.