This example extends the
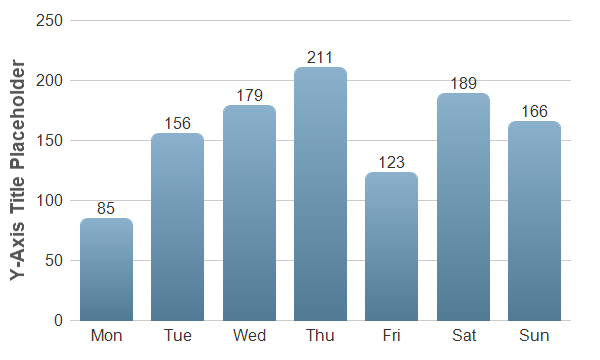
Simple Bar Chart (1) example by including bar labels on the bars, and decorating the bars with rounded corners and gradient shading.
[JSP Version] jspdemo/barlabel.jsp
<%@page import="ChartDirector.*, java.util.*" %>
<%
// The data for the bar chart
double[] data = {85, 156, 179, 211, 123, 189, 166};

// The labels for the bar chart
String[] labels = {"Mon", "Tue", "Wed", "Thu", "Fri", "Sat", "Sun"};

// Create a XYChart object of size 600 x 360 pixels
XYChart c = new XYChart(600, 360);

// Set the plotarea at (70, 20) and of size 500 x 300 pixels, with transparent background and border
// and light grey (0xcccccc) horizontal grid lines
c.setPlotArea(70, 20, 500, 300, Chart.Transparent, -1, Chart.Transparent, 0xcccccc);

// Set the x and y axis stems to transparent and the label font to 12pt Arial
c.xAxis().setColors(Chart.Transparent);
c.yAxis().setColors(Chart.Transparent);
c.xAxis().setLabelStyle("Arial", 12);
c.yAxis().setLabelStyle("Arial", 12);

// Add a blue (0x6699bb) bar chart layer using the given data
BarLayer layer = c.addBarLayer(data, 0x6699bb);

// Use bar gradient lighting with the light intensity from 0.8 to 1.3
layer.setBorderColor(Chart.Transparent, Chart.barLighting(0.8, 1.3));

// Set rounded corners for bars
layer.setRoundedCorners();

// Display labela on top of bars using 12pt Arial font
layer.setAggregateLabelStyle("Arial", 12);

// Set the labels on the x axis.
c.xAxis().setLabels(labels);

// For the automatic y-axis labels, set the minimum spacing to 40 pixels.
c.yAxis().setTickDensity(40);

// Add a title to the y axis using dark grey (0x555555) 14pt Arial Bold font
c.yAxis().setTitle("Y-Axis Title Placeholder", "Arial Bold", 14, 0x555555);

// Output the chart
WebChartViewer viewer = new WebChartViewer(request, "chart1");
viewer.setChart(c, Chart.SVG);

// Include tool tip for the chart
viewer.setImageMap(c.getHTMLImageMap("", "", "title='{xLabel}: ${value}M'"));
%>
<!DOCTYPE html>
<html>
<head>
    <title>Bar Labels</title>
    <!-- Include ChartDirector Javascript Library to support chart interactions -->
    <script type="text/javascript" src="cdjcv.js"></script>
</head>
<body style="margin:5px 0px 0px 5px">
    <div style="font:bold 18pt verdana;">
        Bar Labels
    </div>
    <hr style="border:solid 1px #000080; background:#000080" />
    <div style="font:10pt verdana; margin-bottom:1.5em">
        <a href="viewsource.jsp?file=<%=request.getServletPath()%>">View Source Code</a>
    </div>
    <!-- ****** Here is the chart image ****** -->
    <%= viewer.renderHTML(response) %>
</body>
</html>
© 2021 Advanced Software Engineering Limited. All rights reserved.