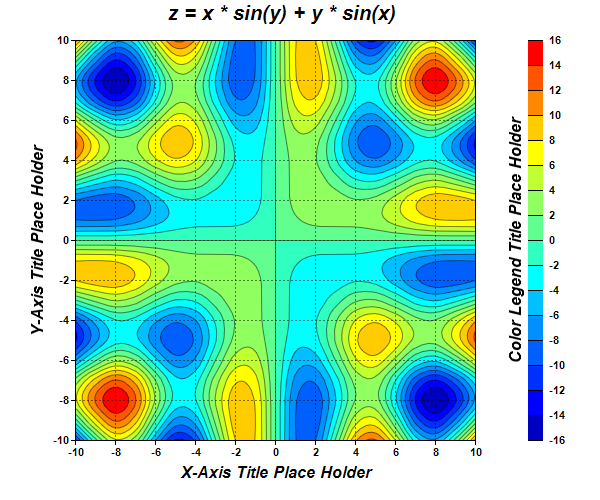
This example demonstrates creating a contour chart.
[JSP Version] jspdemo/contour.jsp
<%@page import="ChartDirector.*, java.util.*" %>
<%
// The x and y coordinates of the grid
double[] dataX = {-10, -9, -8, -7, -6, -5, -4, -3, -2, -1, 0, 1, 2, 3, 4, 5, 6, 7, 8, 9, 10};
double[] dataY = {-10, -9, -8, -7, -6, -5, -4, -3, -2, -1, 0, 1, 2, 3, 4, 5, 6, 7, 8, 9, 10};

// The values at the grid points. In this example, we will compute the values using the formula z =
// x * sin(y) + y * sin(x).
double[] dataZ = new double[dataX.length * dataY.length];
for(int yIndex = 0; yIndex < dataY.length; ++yIndex) {
    double y = dataY[yIndex];
    for(int xIndex = 0; xIndex < dataX.length; ++xIndex) {
        double x = dataX[xIndex];
        dataZ[yIndex * dataX.length + xIndex] = x * Math.sin(y) + y * Math.sin(x);
    }
}

// Create a XYChart object of size 600 x 500 pixels
XYChart c = new XYChart(600, 500);

// Add a title to the chart using 15 points Arial Bold Italic font
c.addTitle("z = x * sin(y) + y * sin(x)      ", "Arial Bold Italic", 15);

// Set the plotarea at (75, 40) and of size 400 x 400 pixels. Use semi-transparent black (80000000)
// dotted lines for both horizontal and vertical grid lines
c.setPlotArea(75, 40, 400, 400, -1, -1, -1, c.dashLineColor(0x80000000, Chart.DotLine), -1);

// Set x-axis and y-axis title using 12 points Arial Bold Italic font
c.xAxis().setTitle("X-Axis Title Place Holder", "Arial Bold Italic", 12);
c.yAxis().setTitle("Y-Axis Title Place Holder", "Arial Bold Italic", 12);

// Set x-axis and y-axis labels to use Arial Bold font
c.xAxis().setLabelStyle("Arial Bold");
c.yAxis().setLabelStyle("Arial Bold");

// When auto-scaling, use tick spacing of 40 pixels as a guideline
c.yAxis().setTickDensity(40);
c.xAxis().setTickDensity(40);

// Add a contour layer using the given data
ContourLayer layer = c.addContourLayer(dataX, dataY, dataZ);

// Move the grid lines in front of the contour layer
c.getPlotArea().moveGridBefore(layer);

// Add a color axis (the legend) in which the top left corner is anchored at (505, 40). Set the
// length to 400 pixels and the labels on the right side.
ColorAxis cAxis = layer.setColorAxis(505, 40, Chart.TopLeft, 400, Chart.Right);

// Add a title to the color axis using 12 points Arial Bold Italic font
cAxis.setTitle("Color Legend Title Place Holder", "Arial Bold Italic", 12);

// Set color axis labels to use Arial Bold font
cAxis.setLabelStyle("Arial Bold");

// Output the chart
WebChartViewer viewer = new WebChartViewer(request, "chart1");
viewer.setChart(c, Chart.SVG);

// Include tool tip for the chart
viewer.setImageMap(c.getHTMLImageMap("", "",
    "title='<*cdml*><*b*>X: {x|2}<*br*>Y: {y|2}<*br*>Z: {z|2}''"));

// Output Javascript chart model to support contour chart tooltips
viewer.setChartModel(c.getJsChartModel());
%>
<!DOCTYPE html>
<html>
<head>
    <title>Contour Chart</title>
    <!-- Include ChartDirector Javascript Library to support chart interactions -->
    <script type="text/javascript" src="cdjcv.js"></script>
</head>
<body style="margin:5px 0px 0px 5px">
    <div style="font:bold 18pt verdana;">
        Contour Chart
    </div>
    <hr style="border:solid 1px #000080; background:#000080" />
    <div style="font:10pt verdana; margin-bottom:1.5em">
        <a href="viewsource.jsp?file=<%=request.getServletPath()%>">View Source Code</a>
    </div>
    <!-- ****** Here is the chart image ****** -->
    <%= viewer.renderHTML(response) %>
</body>
</html>
© 2021 Advanced Software Engineering Limited. All rights reserved.