This example demonstrates using various color scales for contour charts.
ChartDirector supports two ways to configure the color scale:
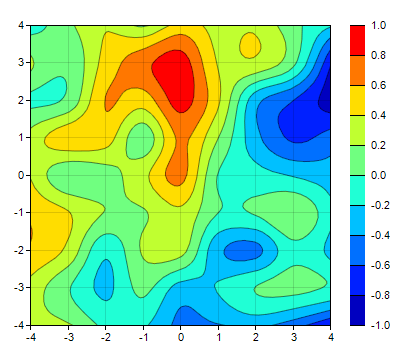
- The ColorAxis.setColorGradient can be used to specify a list of colors to be used for the ColorAxis. With this method, the color scale is determined by other means, and the colors will be applied to the resulting scale, interpolating among the colors if necessary. By default, the color axis scale and labels are automatically determined based on actual data. The axis scale and labels can also be specified by using various Axis methods, such as Axis.setLinearScale, Axis.setLogScale and Axis.setDateScale (please refer to Axis for the full list).
- The ColorAxis.setColorScale can be used to specify both the colors and the associated scale and labels.
This example includes 4 charts to demonstrate both of the above methods.
[JSP Version] jspdemo/contourcolor.jsp
<%@page import="ChartDirector.*, java.util.*" %>
<%!
// Function to create the demo charts
void createChart(WebChartViewer viewer, int chartIndex)
{
// The x and y coordinates of the grid
double[] dataX = {-4, -3, -2, -1, 0, 1, 2, 3, 4};
double[] dataY = {-4, -3, -2, -1, 0, 1, 2, 3, 4};
// Use random numbers for the z values on the XY grid
RanSeries r = new RanSeries(99);
double[] dataZ = r.get2DSeries(dataX.length, dataY.length, -0.9, 0.9);
// Create a XYChart object of size 420 x 360 pixels
XYChart c = new XYChart(420, 360);
// Set the plotarea at (30, 25) and of size 300 x 300 pixels. Use semi-transparent grey
// (0xdd000000) horizontal and vertical grid lines
c.setPlotArea(30, 25, 300, 300, -1, -1, -1, 0xdd000000, -1);
// Set the x-axis and y-axis scale
c.xAxis().setLinearScale(-4, 4, 1);
c.yAxis().setLinearScale(-4, 4, 1);
// Add a contour layer using the given data
ContourLayer layer = c.addContourLayer(dataX, dataY, dataZ);
// Enable contour label by setting its style to black (000000) 8pt default bold font
layer.setContourLabelStyle("bold", 8, 0x000000);
// Set the label to display the value in a CDML block with semi-transparent white (4FFFFFFF)
// background and 2 pixels left/right margin and 1 pixel top/bottom margin
layer.setContourLabelFormat("<*block,bgcolor=4FFFFFFF,margin=2 2 1 1*>{value}");
// Move the grid lines in front of the contour layer
c.getPlotArea().moveGridBefore(layer);
// Add a color axis (the legend) in which the top left corner is anchored at (350, 25). Set the
// length to 400 300 and the labels on the right side.
ColorAxis cAxis = layer.setColorAxis(350, 25, Chart.TopLeft, 300, Chart.Right);
if (chartIndex == 1) {
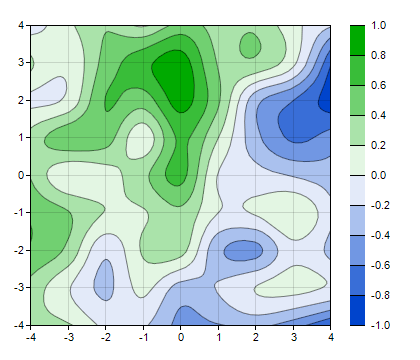
// Speicify a color gradient as a list of colors, and use it in the color axis.
int[] colorGradient = {0x0044cc, 0xffffff, 0x00aa00};
cAxis.setColorGradient(false, colorGradient);
} else if (chartIndex == 2) {
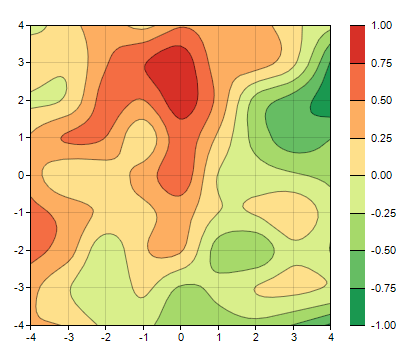
// Specify the color scale to use in the color axis
double[] colorScale = {-1.0, 0x1a9850, -0.75, 0x66bd63, -0.5, 0xa6d96a, -0.25, 0xd9ef8b, 0,
0xfee08b, 0.25, 0xfdae61, 0.5, 0xf46d43, 0.75, 0xd73027, 1};
cAxis.setColorScale(colorScale);
} else if (chartIndex == 3) {
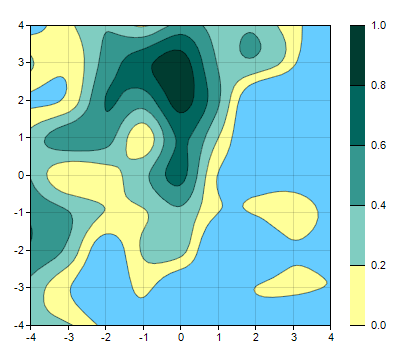
// Specify the color scale to use in the color axis. Also specify an underflow color
// 0x66ccff (blue) for regions that fall below the lower axis limit.
double[] colorScale = {0, 0xffff99, 0.2, 0x80cdc1, 0.4, 0x35978f, 0.6, 0x01665e, 0.8,
0x003c30, 1};
cAxis.setColorScale(colorScale, 0x66ccff);
}
// Output the chart
viewer.setChart(c, Chart.SVG);
// Include tool tip for the chart
viewer.setImageMap(c.getHTMLImageMap("", "",
"title='<*cdml*><*b*>X: {x|2}<*br*>Y: {y|2}<*br*>Z: {z|2}'"));
// Output Javascript chart model to support contour chart tooltips
viewer.setChartModel(c.getJsChartModel());
}
%>
<%
// This example includes 4 charts
WebChartViewer[] viewers = new WebChartViewer[4];
for (int i = 0; i < viewers.length; ++i) {
viewers[i] = new WebChartViewer(request, "chart" + i);
createChart(viewers[i], i);
}
%>
<!DOCTYPE html>
<html>
<head>
<title>Contour Color Scale</title>
<!-- Include ChartDirector Javascript Library to support chart interactions -->
<script type="text/javascript" src="cdjcv.js"></script>
</head>
<body style="margin:5px 0px 0px 5px">
<div style="font:bold 18pt verdana;">
Contour Color Scale
</div>
<hr style="border:solid 1px #000080; background:#000080" />
<div style="font:10pt verdana; margin-bottom:1.5em">
<a href="viewsource.jsp?file=<%=request.getServletPath()%>">View Source Code</a>
</div>
<!-- ****** Here are the chart images ****** -->
<%
for (int i = 0; i < viewers.length; ++i) {
out.write(viewers[i].renderHTML(response));
out.write(" ");
}
%>
</body>
</html>
© 2021 Advanced Software Engineering Limited. All rights reserved.