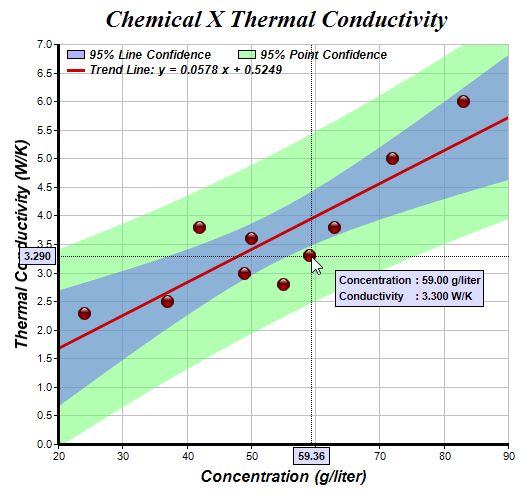
This sample program demonstrates a track cursor programmed as a crosshair cursor with axis labels. In additional, it demonstrates using hot spot events to pop up a box when the mouse is over a data point or the trend line, showing information about these objects with HTML formatting.
The key elements of the server side charting code are as follows:
- The code draws the chart as usual.
- The code configures the image map for the scatter layer to call the Javascript function showDataPointToolTip on mouse over, and call hideToolTip on mouse out.
- The code configures the image map for the trend layer to call the Javascript function showTrendLineToolTip on mouse over, and call hideToolTip on mouse out.
- The code outputs the chart image, the image map and the Javascript Chart Model to the browser.
The showDataPointToolTip and showTrendLineToolTip Javascript functions are the routines that draw the pop up box to display tooltips for the data points and the trend line. They use JsChartViewer.showTextBox to draw the box 20 pixels away from the mouse cursor. The hideToolTip hides the pop up box using JsChartViewer.hideObj.
[JSP Version] jspdemo/crosshair.jsp
<%@page import="ChartDirector.*, java.util.*" %>
<%
// The XY data of the first data series
double[] dataX = {50, 55, 37, 24, 42, 49, 63, 72, 83, 59};
double[] dataY = {3.6, 2.8, 2.5, 2.3, 3.8, 3.0, 3.8, 5.0, 6.0, 3.3};

// Create a XYChart object of size 520 x 490 pixels
XYChart c = new XYChart(520, 490);

// Set the plotarea at (60, 40) and of size 450 x 400 pixels, with white background and a light grey
// border (0xc0c0c0). Turn on both horizontal and vertical grid lines with light grey color
// (0xc0c0c0)
c.setPlotArea(60, 40, 450, 400, 0xffffff, -1, 0xc0c0c0, 0xc0c0c0, -1);

// Add a title to the chart using 18 point Times Bold Itatic font.
c.addTitle("      Chemical X Thermal Conductivity", "Times New Roman Bold Italic", 18);

// Add titles to the axes using 12pt Arial Bold Italic font
c.yAxis().setTitle("Thermal Conductivity (W/K)", "Arial Bold Italic", 12);
c.xAxis().setTitle("Concentration (g/liter)", "Arial Bold Italic", 12);

// Set the axes line width to 3 pixels
c.yAxis().setWidth(3);
c.xAxis().setWidth(3);

// Add a scatter layer using (dataX, dataY)
ScatterLayer scatterLayer = c.addScatterLayer(dataX, dataY, "", Chart.GlassSphereShape, 13, 0xcc0000
    );

// Show custom Javascript tooltip for the scatter layer
scatterLayer.setHTMLImageMap("", "",
    "onmouseover='showDataPointToolTip({x}, {value})' onmouseout='hideToolTip()'");

// Add a trend line layer for (dataX, dataY)
TrendLayer trendLayer = c.addTrendLayer2(dataX, dataY, 0xcc0000);

// Set the line width to 3 pixels
trendLayer.setLineWidth(3);

// Add a 95% confidence band for the line
trendLayer.addConfidenceBand(0.95, 0x806666ff);

// Add a 95% confidence band (prediction band) for the points
trendLayer.addPredictionBand(0.95, 0x8066ff66);

// Show custom Javascript tooltip for the trend layer
trendLayer.setHTMLImageMap("", "",
    "onmouseover='showTrendLineToolTip({slope}, {intercept})' onmouseout='hideToolTip()'");

// Add a legend box at (60, 35) (top of the chart) with horizontal layout. Use 10pt Arial Bold
// Italic font. Set the background and border color to Transparent and use line style legend icons.
LegendBox legendBox = c.addLegend(60, 35, false, "Arial Bold Italic", 9);
legendBox.setBackground(Chart.Transparent);
legendBox.setLineStyleKey(true);

// Add entries to the legend box
legendBox.addKey("95% Line Confidence", 0x806666ff);
legendBox.addKey("95% Point Confidence", 0x8066ff66);
legendBox.addKey(String.format("Trend Line: y = %.4f x + %.4f", trendLayer.getSlope(),
    trendLayer.getIntercept()), 0xcc0000, 3);

// Create the WebChartViewer object
WebChartViewer viewer = new WebChartViewer(request, "chart1");

// Output the chart
viewer.setChart(c, Chart.SVG);

// Include tool tip for the chart
viewer.setImageMap(c.getHTMLImageMap(""));

// Output Javascript chart model to the browser to support tracking cursor
viewer.setChartModel(c.getJsChartModel());
%>
<!DOCTYPE html>
<html>
<head>
    <title>Crosshair with Axis Labels</title>
    <script type="text/javascript" src="cdjcv.js"></script>
</head>
<body style="margin:5px 0px 0px 5px">
<script type="text/javascript">

//
// Use the window load event to set up the MouseMovePlotArea event handler
//
JsChartViewer.addEventListener(window, 'load', function() {
    var viewer = JsChartViewer.get('<%=viewer.getId()%>');

    // Draw track cursor when mouse is moving over plotarea. Hide it when mouse leaves plot area.
    viewer.attachHandler(["MouseMovePlotArea", "TouchStartPlotArea", "TouchMovePlotArea", "ChartMove"],
    function(e) {
        this.preventDefault(e);   // Prevent the browser from using touch events for other actions
        crossHairAxisLabel(viewer, viewer.getPlotAreaMouseX(), viewer.getPlotAreaMouseY());
        viewer.setAutoHide("all", ["MouseOutPlotArea", "TouchEndPlotArea"]);
    });
});

//
// Draw cross hair cursor with axis labels
//
function crossHairAxisLabel(viewer, x, y)
{
    // Show cross hair
    viewer.showCrossHair(x, y);

    // The chart, its plot area and axes
    var c = viewer.getChart();
    var xAxis = c.xAxis();
    var yAxis = c.yAxis();

    // The axis label style
    var labelStyle = "padding:2px 4px; font: bold 8pt arial; border:1px solid black;" +
        "background-color:#DDDDFF; -webkit-text-size-adjust:100%;";

    // Draw x-axis label
    var yPos = xAxis.getY() + ((xAxis.getAlignment() == JsChartViewer.Top) ? -2 : 3);
    var alignment = (xAxis.getAlignment() == JsChartViewer.Top) ? JsChartViewer.Bottom : JsChartViewer.Top;
    viewer.showTextBox("xAxisLabel", x, yPos, alignment, c.getXValue(x).toPrecision(4), labelStyle);

    // Draw y-axis label
    var xPos = yAxis.getX() + ((yAxis.getAlignment() == JsChartViewer.Left) ? -2 : 3);
    var alignment = (yAxis.getAlignment() == JsChartViewer.Left) ? JsChartViewer.Right : JsChartViewer.Left;
    viewer.showTextBox("yAxisLabel", xPos, y, alignment, c.getYValue(y, yAxis).toPrecision(4), labelStyle);
}

//
// Show custom tooltip for data points
//
function showDataPointToolTip(x, y)
{
    var viewer = JsChartViewer.get('<%=viewer.getId()%>');
    viewer.showTextBox("toolTipBox", viewer.getChartMouseX() + 20, viewer.getChartMouseY() + 20, JsChartViewer.TopLeft,
        "<table><tr><td>Concentration</td><td>: " + x.toPrecision(4) +
        " g/liter</td></tr><tr><td>Conductivity</td><td>: " + y.toPrecision(4) + " W/K</td></tr></table>",
        "padding:0px; font:bold 8pt arial; border:1px solid black; background-color:#DDDDFF");
}

//
// Show custom tooltip for the trend line
//
function showTrendLineToolTip(slope, intercept)
{
    var viewer = JsChartViewer.get('<%=viewer.getId()%>');
    viewer.showTextBox("toolTipBox", viewer.getChartMouseX() + 20, viewer.getChartMouseY() + 20, JsChartViewer.TopLeft,
        "Trend Line: y = " + slope.toFixed(4) + " x + " + intercept.toFixed(4),
        "padding:2px 4px; font:bold 8pt arial; border:1px solid black; background-color:#DDDDFF");
}

//
// Hide custom tooltip
//
function hideToolTip()
{
    var viewer = JsChartViewer.get('<%=viewer.getId()%>');
    viewer.hideObj("toolTipBox");
}

</script>
<div style="font-size:18pt; font-family:verdana; font-weight:bold">
    Crosshair with Axis Labels
</div>
<hr style="border:solid 1px #000080" />
<div style="font-size:10pt; font-family:verdana; margin-bottom:1.5em">
    <a href="viewsource.jsp?file=<%=request.getServletPath()%>">View Source Code</a>
</div>
<!-- ****** Here is the chart image ****** -->
<%=viewer.renderHTML(response)%>
</body>
</html>
© 2021 Advanced Software Engineering Limited. All rights reserved.