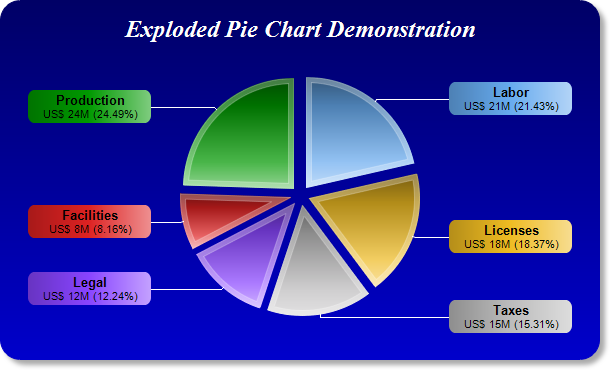
This example demonstrates a pie chart with all sectors exploded. It also demonstrates many effects, such as gradient color background, rounded frame, soft drop shadow, custom sector colors, sector gradient shading, thick sector border, and using
CDML and
Parameter Substitution and Formatting to format sector labels.
[JSP Version] jspdemo/explodedpie.jsp
<%@page import="ChartDirector.*, java.util.*" %>
<%
// The data for the pie chart
double[] data = {21, 18, 15, 12, 8, 24};

// The labels for the pie chart
String[] labels = {"Labor", "Licenses", "Taxes", "Legal", "Facilities", "Production"};

// The colors to use for the sectors
int[] colors = {0x66aaee, 0xeebb22, 0xbbbbbb, 0x8844ff, 0xdd2222, 0x009900};

// Create a PieChart object of size 600 x 360 pixels.
PieChart c = new PieChart(600, 360);

// Use the white on black palette, which means the default text and line colors are white
c.setColors(Chart.whiteOnBlackPalette);

// Use a vertical gradient color from deep blue (000066) to blue (0000cc) as background. Use rounded
// corners of 20 pixels radius. Enable soft drop shadow.
c.setBackground(c.linearGradientColor(0, 0, 0, c.getHeight(), 0x000066, 0x0000cc));
c.setRoundedFrame(0xffffff, 20);
c.setDropShadow();

// Add a title using 18pt Times New Roman Bold Italic font. Add 16 pixels top margin to the title.
c.addTitle("Exploded Pie Chart Demonstration", "Times New Roman Bold Italic", 18).setMargin2(0, 0,
    16, 0);

// Set the center of the pie at (300, 195) and the radius to 110 pixels
c.setPieSize(300, 195, 110);

// Set the pie data and the pie labels
c.setData(data, labels);

// Set the sector colors
c.setColors2(Chart.DataColor, colors);

// Use local gradient shading for the sectors, with 5 pixels wide semi-transparent white (bbffffff)
// borders
c.setSectorStyle(Chart.LocalGradientShading, 0xbbffffff, 5);

// Use the side label layout method
c.setLabelLayout(Chart.SideLayout);

// Use 10pt Arial Bold as the default label font. Set the label box background color the same as the
// sector color. Use soft lighting effect with light direction from right. Use 8 pixels rounded
// corners.
TextBox t = c.setLabelStyle("Arial Bold", 10, 0x000000);
t.setBackground(Chart.SameAsMainColor, Chart.Transparent, Chart.softLighting(Chart.Right, 0));
t.setRoundedCorners(8);

// Set the sector label format. The label is centered in a 110 pixels wide bounding box. It consists
// of two lines. The first line is the sector name. The second line shows the data value and
// percentage.
c.setLabelFormat(
    "<*block,halign=center,width=110*>{label}\n<*font=Arial,size=8*>US$ {value}M ({percent}%)<*/*>")
    ;

// Explode all sectors 10 pixels from the center
c.setExplode(-1, 10);

// Output the chart
WebChartViewer viewer = new WebChartViewer(request, "chart1");
viewer.setChart(c, Chart.SVG);

// Include tool tip for the chart
viewer.setImageMap(c.getHTMLImageMap("", "", "title='{label}: US${value}M ({percent}%)'"));
%>
<!DOCTYPE html>
<html>
<head>
    <title>Exploded Pie Chart</title>
    <!-- Include ChartDirector Javascript Library to support chart interactions -->
    <script type="text/javascript" src="cdjcv.js"></script>
</head>
<body style="margin:5px 0px 0px 5px">
    <div style="font:bold 18pt verdana;">
        Exploded Pie Chart
    </div>
    <hr style="border:solid 1px #000080; background:#000080" />
    <div style="font:10pt verdana; margin-bottom:1.5em">
        <a href="viewsource.jsp?file=<%=request.getServletPath()%>">View Source Code</a>
    </div>
    <!-- ****** Here is the chart image ****** -->
    <%= viewer.renderHTML(response) %>
</body>
</html>
© 2021 Advanced Software Engineering Limited. All rights reserved.