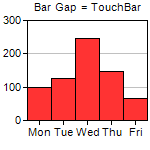
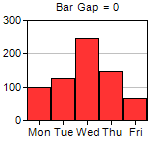

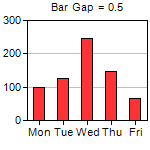
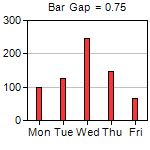
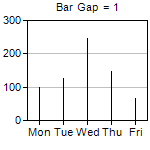
This example demonstrates the effects of different bar gaps configured using BarLayer.setBarGap.
ChartDirector 7.0 (Java Edition)
Bar Gap
Source Code Listing
<%@page import="ChartDirector.*, java.util.*" %>
<%!
// Function to create the demo charts
void createChart(WebChartViewer viewer, int chartIndex)
{
    double bargap = chartIndex * 0.25 - 0.25;

    // The data for the bar chart
    double[] data = {100, 125, 245, 147, 67};

    // The labels for the bar chart
    String[] labels = {"Mon", "Tue", "Wed", "Thu", "Fri"};

    // Create a XYChart object of size 150 x 150 pixels
    XYChart c = new XYChart(150, 150);

    // Set the plotarea at (27, 20) and of size 120 x 100 pixels
    c.setPlotArea(27, 20, 120, 100);

    // Set the labels on the x axis
    c.xAxis().setLabels(labels);

    if (bargap >= 0) {
        // Add a title to display to bar gap using 8pt Arial font
        c.addTitle("      Bar Gap = " + bargap, "Arial", 8);
    } else {
        // Use negative value to mean TouchBar
        c.addTitle("      Bar Gap = TouchBar", "Arial", 8);
        bargap = Chart.TouchBar;
    }

    // Add a bar chart layer using the given data and set the bar gap
    c.addBarLayer(data).setBarGap(bargap);

    // Output the chart
    viewer.setChart(c, Chart.SVG);

    // Include tool tip for the chart
    viewer.setImageMap(c.getHTMLImageMap("", "", "title='Production on {xLabel}: {value} kg'"));
}
%>
<%
// This example includes 6 charts
WebChartViewer[] viewers = new WebChartViewer[6];
for (int i = 0; i < viewers.length; ++i) {
    viewers[i] = new WebChartViewer(request, "chart" + i);
    createChart(viewers[i], i);
}
%>
<!DOCTYPE html>
<html>
<head>
    <title>Bar Gap</title>
    <!-- Include ChartDirector Javascript Library to support chart interactions -->
    <script type="text/javascript" src="cdjcv.js"></script>
</head>
<body style="margin:5px 0px 0px 5px">
    <div style="font:bold 18pt verdana;">
        Bar Gap
    </div>
    <hr style="border:solid 1px #000080; background:#000080" />
    <div style="font:10pt verdana; margin-bottom:1.5em">
        <a href="viewsource.jsp?file=<%=request.getServletPath()%>">View Source Code</a>
    </div>
    <!-- ****** Here are the chart images ****** -->
    <%
        for (int i = 0; i < viewers.length; ++i) {
            out.write(viewers[i].renderHTML(response));
            out.write(" ");
        }
    %>
</body>
</html>