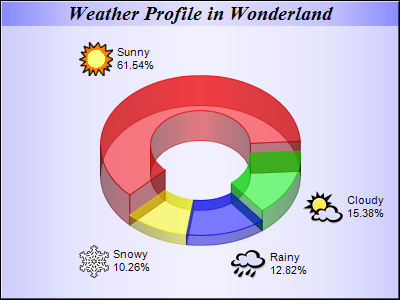
This example modifies the
Icon Pie Chart example by using a semi-transparent donut instead of a pie, and using metallic background color.
[JSP Version] jspdemo/icondonut.jsp
<%@page import="ChartDirector.*, java.util.*" %>
<%
// The data for the pie chart
double[] data = {72, 18, 15, 12};

// The depths for the sectors
double[] depths = {30, 20, 10, 10};

// The labels for the pie chart
String[] labels = {"Sunny", "Cloudy", "Rainy", "Snowy"};

// The icons for the sectors
String[] icons = {"sun.png", "cloud.png", "rain.png", "snowy.png"};

// Create a PieChart object of size 400 x 300 pixels
PieChart c = new PieChart(400, 300);

// Use the semi-transparent palette for this chart
c.setColors(Chart.transparentPalette);

// Set the background to metallic light blue (CCFFFF), with a black border and 1 pixel 3D border
// effect,
c.setBackground(Chart.metalColor(0xccccff), 0x000000, 1);

//Set search path to current JSP directory for loading icon images
c.setSearchPath(getServletConfig().getServletContext(), request);

// Set donut center at (200, 175), and outer/inner radii as 100/50 pixels
c.setDonutSize(200, 175, 100, 50);

// Add a title box using 15pt Times Bold Italic font and metallic blue (8888FF) background color
c.addTitle("Weather Profile in Wonderland", "Times New Roman Bold Italic", 15).setBackground(
    Chart.metalColor(0x8888ff));

// Set the pie data and the pie labels
c.setData(data, labels);

// Add icons to the chart as a custom field
c.addExtraField(icons);

// Configure the sector labels using CDML to include the icon images
c.setLabelFormat("<*block,valign=absmiddle*><*img={field0}*> <*block*>{label}\n{percent}%<*/*><*/*>"
    );

// Draw the pie in 3D with variable 3D depths
c.set3D2(depths);

// Set the start angle to 225 degrees may improve layout when the depths of the sector are sorted in
// descending order, because it ensures the tallest sector is at the back.
c.setStartAngle(225);

// Output the chart
WebChartViewer viewer = new WebChartViewer(request, "chart1");
viewer.setChart(c, Chart.SVG);

// Include tool tip for the chart
viewer.setImageMap(c.getHTMLImageMap("", "", "title='{label}: {value} days ({percent}%)'"));
%>
<!DOCTYPE html>
<html>
<head>
    <title>Icon Donut Chart</title>
    <!-- Include ChartDirector Javascript Library to support chart interactions -->
    <script type="text/javascript" src="cdjcv.js"></script>
</head>
<body style="margin:5px 0px 0px 5px">
    <div style="font:bold 18pt verdana;">
        Icon Donut Chart
    </div>
    <hr style="border:solid 1px #000080; background:#000080" />
    <div style="font:10pt verdana; margin-bottom:1.5em">
        <a href="viewsource.jsp?file=<%=request.getServletPath()%>">View Source Code</a>
    </div>
    <!-- ****** Here is the chart image ****** -->
    <%= viewer.renderHTML(response) %>
</body>
</html>
© 2021 Advanced Software Engineering Limited. All rights reserved.