This example demonstrates a horizontal linear meter with multiple pointers.
ChartDirector 7.0 (Java Edition)
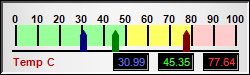
Multi-Pointer Horizontal Meter
Source Code Listing
<%@page import="ChartDirector.*, java.util.*" %>
<%
// The values to display on the meter
double value0 = 30.99;
double value1 = 45.35;
double value2 = 77.64;

// Create an LinearMeter object of size 250 x 75 pixels, using silver background with a 2 pixel
// black 3D depressed border.
LinearMeter m = new LinearMeter(250, 75, Chart.silverColor(), 0, -2);

// Set the scale region top-left corner at (15, 25), with size of 220 x 20 pixels. The scale labels
// are located on the top (implies horizontal meter)
m.setMeter(15, 25, 220, 20, Chart.Top);

// Set meter scale from 0 - 100, with a tick every 10 units
m.setScale(0, 100, 10);

// Set 0 - 50 as green (99ff99) zone, 50 - 80 as yellow (ffff66) zone, and 80 - 100 as red (ffcccc)
// zone
m.addZone(0, 50, 0x99ff99);
m.addZone(50, 80, 0xffff66);
m.addZone(80, 100, 0xffcccc);

// Add deep red (000080), deep green (008000) and deep blue (800000) pointers to reflect the values
m.addPointer(value0, 0x000080);
m.addPointer(value1, 0x008000);
m.addPointer(value2, 0x800000);

// Add a label at bottom-left (10, 68) using Arial Bold/8pt/red (c00000)
m.addText(10, 68, "Temp C", "Arial Bold", 8, 0xc00000, Chart.BottomLeft);

// Add three text boxes to show the values in this meter
m.addText(148, 70, m.formatValue(value0, "2"), "Arial", 8, 0x6666ff, Chart.BottomRight
    ).setBackground(0, 0, -1);
m.addText(193, 70, m.formatValue(value1, "2"), "Arial", 8, 0x33ff33, Chart.BottomRight
    ).setBackground(0, 0, -1);
m.addText(238, 70, m.formatValue(value2, "2"), "Arial", 8, 0xff3333, Chart.BottomRight
    ).setBackground(0, 0, -1);

// Output the chart
WebChartViewer viewer = new WebChartViewer(request, "chart1");
viewer.setChart(m, Chart.SVG);
%>
<!DOCTYPE html>
<html>
<head>
    <title>Multi-Pointer Horizontal Meter</title>
    <!-- Include ChartDirector Javascript Library to support chart interactions -->
    <script type="text/javascript" src="cdjcv.js"></script>
</head>
<body style="margin:5px 0px 0px 5px">
    <div style="font:bold 18pt verdana;">
        Multi-Pointer Horizontal Meter
    </div>
    <hr style="border:solid 1px #000080; background:#000080" />
    <div style="font:10pt verdana; margin-bottom:1.5em">
        <a href="viewsource.jsp?file=<%=request.getServletPath()%>">View Source Code</a>
    </div>
    <!-- ****** Here is the chart image ****** -->
    <%= viewer.renderHTML(response) %>
</body>
</html>