[JSP Version] jspdemo/multipie.jsp
<%@page import="ChartDirector.*, java.util.*" %>
<%!
// Function to create the demo charts
void createChart(WebChartViewer viewer, int chartIndex)
{
// The data for the pie chart
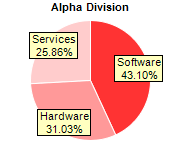
double[] data0 = {25, 18, 15};
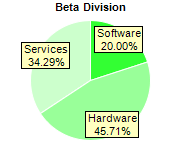
double[] data1 = {14, 32, 24};
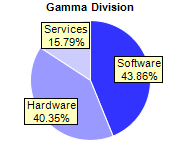
double[] data2 = {25, 23, 9};
// The labels for the pie chart
String[] labels = {"Software", "Hardware", "Services"};
// Create a PieChart object of size 180 x 160 pixels
PieChart c = new PieChart(180, 160);
// Set the center of the pie at (90, 80) and the radius to 60 pixels
c.setPieSize(90, 80, 60);
// Set the border color of the sectors to white (ffffff)
c.setLineColor(0xffffff);
// Set the background color of the sector label to pale yellow (ffffc0) with a black border
// (000000)
c.setLabelStyle().setBackground(0xffffc0, 0x000000);
// Set the label to be slightly inside the perimeter of the circle
c.setLabelLayout(Chart.CircleLayout, -10);
// Set the title, data and colors according to which pie to draw
if (chartIndex == 0) {
c.addTitle("Alpha Division", "Arial Bold", 8);
c.setData(data0, labels);
int[] colors0 = {0xff3333, 0xff9999, 0xffcccc};
c.setColors2(Chart.DataColor, colors0);
} else if (chartIndex == 1) {
c.addTitle("Beta Division", "Arial Bold", 8);
c.setData(data1, labels);
int[] colors1 = {0x33ff33, 0x99ff99, 0xccffcc};
c.setColors2(Chart.DataColor, colors1);
} else {
c.addTitle("Gamma Division", "Arial Bold", 8);
c.setData(data2, labels);
int[] colors2 = {0x3333ff, 0x9999ff, 0xccccff};
c.setColors2(Chart.DataColor, colors2);
}
// Output the chart
viewer.setChart(c, Chart.SVG);
// Include tool tip for the chart
viewer.setImageMap(c.getHTMLImageMap("", "", "title='{label}: US${value}M ({percent}%)'"));
}
%>
<%
// This example includes 3 charts
WebChartViewer[] viewers = new WebChartViewer[3];
for (int i = 0; i < viewers.length; ++i) {
viewers[i] = new WebChartViewer(request, "chart" + i);
createChart(viewers[i], i);
}
%>
<!DOCTYPE html>
<html>
<head>
<title>Multi-Pie Chart</title>
<!-- Include ChartDirector Javascript Library to support chart interactions -->
<script type="text/javascript" src="cdjcv.js"></script>
</head>
<body style="margin:5px 0px 0px 5px">
<div style="font:bold 18pt verdana;">
Multi-Pie Chart
</div>
<hr style="border:solid 1px #000080; background:#000080" />
<div style="font:10pt verdana; margin-bottom:1.5em">
<a href="viewsource.jsp?file=<%=request.getServletPath()%>">View Source Code</a>
</div>
<!-- ****** Here are the chart images ****** -->
<%
for (int i = 0; i < viewers.length; ++i) {
out.write(viewers[i].renderHTML(response));
out.write(" ");
}
%>
</body>
</html>
© 2021 Advanced Software Engineering Limited. All rights reserved.