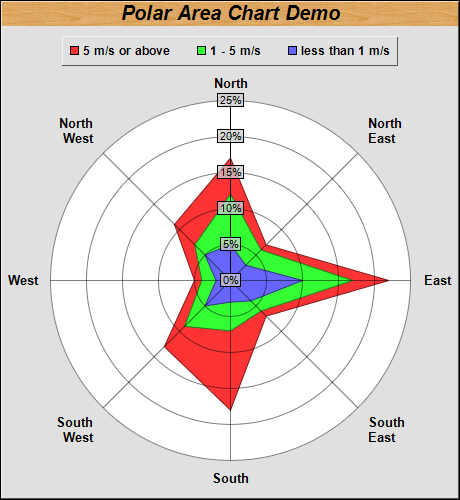
This examples demonstrates a polar area chart.
The polar area layer is created using PolarChart.addAreaLayer. In this example, 3 area layers are used. The area data are already stacked before passing to ChartDirector.
ChartDirector 7.0 (Java Edition)
Polar Area Chart
Source Code Listing
<%@page import="ChartDirector.*, java.util.*" %>
<%
// Data for the chart
double[] data0 = {5, 3, 10, 4, 3, 5, 2, 5};
double[] data1 = {12, 6, 17, 6, 7, 9, 4, 7};
double[] data2 = {17, 7, 22, 7, 18, 13, 5, 11};

String[] labels = {"North", "North<*br*>East", "East", "South<*br*>East", "South",
    "South<*br*>West", "West", "North<*br*>West"};

// Create a PolarChart object of size 460 x 500 pixels, with a grey (e0e0e0) background and 1 pixel
// 3D border
PolarChart c = new PolarChart(460, 500, 0xe0e0e0, 0x000000, 1);

// Add a title to the chart at the top left corner using 15pt Arial Bold Italic font. Use a wood
// pattern as the title background.
c.addTitle("Polar Area Chart Demo", "Arial Bold Italic", 15).setBackground(c.patternColor("wood.png"
    ));

// Set center of plot area at (230, 280) with radius 180 pixels, and white (ffffff) background.
c.setPlotArea(230, 280, 180, 0xffffff);

// Set the grid style to circular grid
c.setGridStyle(false);

// Add a legend box at top-center of plot area (230, 35) using horizontal layout. Use 10pt Arial
// Bold font, with 1 pixel 3D border effect.
LegendBox b = c.addLegend(230, 35, false, "Arial Bold", 9);
b.setAlignment(Chart.TopCenter);
b.setBackground(Chart.Transparent, Chart.Transparent, 1);

// Set angular axis using the given labels
c.angularAxis().setLabels(labels);

// Specify the label format for the radial axis
c.radialAxis().setLabelFormat("{value}%");

// Set radial axis label background to semi-transparent grey (40cccccc)
c.radialAxis().setLabelStyle().setBackground(0x40cccccc, 0);

// Add the data as area layers
c.addAreaLayer(data2, -1, "5 m/s or above");
c.addAreaLayer(data1, -1, "1 - 5 m/s");
c.addAreaLayer(data0, -1, "less than 1 m/s");

// Output the chart
WebChartViewer viewer = new WebChartViewer(request, "chart1");
viewer.setChart(c, Chart.SVG);

// Include tool tip for the chart
viewer.setImageMap(c.getHTMLImageMap("", "", "title='[{label}] {dataSetName}: {value}%'"));
%>
<!DOCTYPE html>
<html>
<head>
    <title>Polar Area Chart</title>
    <!-- Include ChartDirector Javascript Library to support chart interactions -->
    <script type="text/javascript" src="cdjcv.js"></script>
</head>
<body style="margin:5px 0px 0px 5px">
    <div style="font:bold 18pt verdana;">
        Polar Area Chart
    </div>
    <hr style="border:solid 1px #000080; background:#000080" />
    <div style="font:10pt verdana; margin-bottom:1.5em">
        <a href="viewsource.jsp?file=<%=request.getServletPath()%>">View Source Code</a>
    </div>
    <!-- ****** Here is the chart image ****** -->
    <%= viewer.renderHTML(response) %>
</body>
</html>