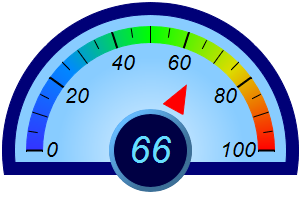
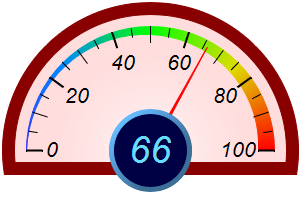
This example demonstrates semicircle meters configured with a large pointer cap to display the meter value.
The pointer cap is the circular object at the center of the meter. In this example, using
AngularMeter.setCap2, the pointer cap is set to an exceptionally large size so that it can act as a place to display text. The text is added using
BaseChart.addText, centered at the meter center.
In one of the meters, the pointer is configured to be floating, which means the base of the pointer is not fixed at the meter center. The pointer looks like a triangle somewhere between the center and the perimeter, pointing to the meter value. This pointer is added using
AngularMeter.addPointer2 with
TriangularPointer2 just like a standard pointer, but with additional arguments to specify the radial position of the pointer base and tip, as well as the pointer width.
[JSP Version] jspdemo/semicirclemeterreadout.jsp
<%@page import="ChartDirector.*, java.util.*" %>
<%!
// Function to create the demo charts
void createChart(WebChartViewer viewer, int chartIndex)
{
    // The value to display on the meter
    double value = 66;

    // The background and border colors of the meters
    int[] bgColor = {0x88ccff, 0xffdddd};
    int[] borderColor = {0x000077, 0x880000};

    // Create an AngularMeter object of size 300 x 200 pixels with transparent background
    AngularMeter m = new AngularMeter(300, 200, Chart.Transparent);

    // Center at (150, 150), scale radius = 124 pixels, scale angle -90 to +90 degrees
    m.setMeter(150, 150, 124, -90, 90);

    // Background gradient color with brighter color at the center
    double[] bgGradient = {0, m.adjustBrightness(bgColor[chartIndex], 3), 0.75, bgColor[chartIndex]}
        ;

    // Add a scale background of 148 pixels radius using the background gradient, with a 13 pixel
    // thick border
    m.addScaleBackground(148, m.relativeRadialGradient(bgGradient), 13, borderColor[chartIndex]);

    // Meter scale is 0 - 100, with major tick every 20 units, minor tick every 10 units, and micro
    // tick every 5 units
    m.setScale(0, 100, 20, 10, 5);

    // Set the scale label style to 15pt Arial Italic. Set the major/minor/micro tick lengths to
    // 16/16/10 pixels pointing inwards, and their widths to 2/1/1 pixels.
    m.setLabelStyle("Arial Italic", 16);
    m.setTickLength(-16, -16, -10);
    m.setLineWidth(0, 2, 1, 1);

    // Demostrate different types of color scales and putting them at different positions
    double[] smoothColorScale = {0, 0x3333ff, 25, 0x0088ff, 50, 0x00ff00, 75, 0xdddd00, 100,
        0xff0000};

    if (chartIndex == 0) {
        // Add the smooth color scale at the default position
        m.addColorScale(smoothColorScale);
        // Add a red (0xff0000) triangular pointer starting from 38% and ending at 60% of scale
        // radius, with a width 6 times the default
        m.addPointer2(value, 0xff0000, -1, Chart.TriangularPointer2, 0.38, 0.6, 6);
    } else {
        // Add the smooth color scale starting at radius 124 with zero width and ending at radius
        // 124 with 16 pixels inner width
        m.addColorScale(smoothColorScale, 124, 0, 124, -16);
        // Add a red (0xff0000) pointer
        m.addPointer2(value, 0xff0000);
    }

    // Configure a large "pointer cap" to be used as the readout circle at the center. The cap
    // radius and border width is set to 33% and 4% of the meter scale radius. The cap color is dark
    // blue (0x000044). The border color is light blue (0x66bbff) with a 60% brightness gradient
    // effect.
    m.setCap2(Chart.Transparent, 0x000044, 0x66bbff, 0.6, 0, 0.33, 0.04);

    // Add value label at the center with light blue (0x66ddff) 28pt Arial Italic font
    m.addText(150, 150, m.formatValue(value, "{value|0}"), "Arial Italic", 28, 0x66ddff,
        Chart.Center).setMargin(0);

    // Output the chart
    viewer.setChart(m, Chart.SVG);
}
%>
<%
// This example includes 2 charts
WebChartViewer[] viewers = new WebChartViewer[2];
for (int i = 0; i < viewers.length; ++i) {
    viewers[i] = new WebChartViewer(request, "chart" + i);
    createChart(viewers[i], i);
}
%>
<!DOCTYPE html>
<html>
<head>
    <title>Semicircle Meter with Readout</title>
    <!-- Include ChartDirector Javascript Library to support chart interactions -->
    <script type="text/javascript" src="cdjcv.js"></script>
</head>
<body style="margin:5px 0px 0px 5px">
    <div style="font:bold 18pt verdana;">
        Semicircle Meter with Readout
    </div>
    <hr style="border:solid 1px #000080; background:#000080" />
    <div style="font:10pt verdana; margin-bottom:1.5em">
        <a href="viewsource.jsp?file=<%=request.getServletPath()%>">View Source Code</a>
    </div>
    <!-- ****** Here are the chart images ****** -->
    <%
        for (int i = 0; i < viewers.length; ++i) {
            out.write(viewers[i].renderHTML(response));
            out.write(" ");
        }
    %>
</body>
</html>
© 2021 Advanced Software Engineering Limited. All rights reserved.