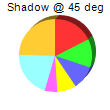
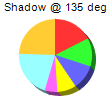
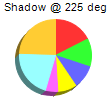
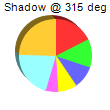
This example demonstrates an alternative 3D drawing method that uses shadows.
The standard way to draw a pie chart in 3D is to view the chart from an inclined angle. Using this method, the surface of a 3D pie will become an ellipse.
ChartDirector supports an alternative way to draw a pie chart in 3D - to draw the 3D portion like a shadow. The 3D pie will remain perfectly circular, and the sector areas will correctly reflect its percentages.
The 3D drawing method is configured using
PieChart.set3D.
[JSP Version] jspdemo/shadowpie.jsp
<%@page import="ChartDirector.*, java.util.*" %>
<%!
// Function to create the demo charts
void createChart(WebChartViewer viewer, int chartIndex)
{
    // the tilt angle of the pie
    int angle = chartIndex * 90 + 45;

    // The data for the pie chart
    double[] data = {25, 18, 15, 12, 8, 30, 35};

    // The labels for the pie chart
    String[] labels = {"Labor", "Licenses", "Taxes", "Legal", "Insurance", "Facilities",
        "Production"};

    // Create a PieChart object of size 110 x 110 pixels
    PieChart c = new PieChart(110, 110);

    // Set the center of the pie at (50, 55) and the radius to 36 pixels
    c.setPieSize(55, 55, 36);

    // Set the depth, tilt angle and 3D mode of the 3D pie (-1 means auto depth, "true" means the 3D
    // effect is in shadow mode)
    c.set3D(-1, angle, true);

    // Add a title showing the shadow angle
    c.addTitle("Shadow @ " + angle + " deg", "Arial", 8);

    // Set the pie data
    c.setData(data, labels);

    // Disable the sector labels by setting the color to Transparent
    c.setLabelStyle("", 8, Chart.Transparent);

    // Output the chart
    viewer.setChart(c, Chart.SVG);

    // Include tool tip for the chart
    viewer.setImageMap(c.getHTMLImageMap("", "", "title='{label}: US${value}K ({percent}%)'"));
}
%>
<%
// This example includes 4 charts
WebChartViewer[] viewers = new WebChartViewer[4];
for (int i = 0; i < viewers.length; ++i) {
    viewers[i] = new WebChartViewer(request, "chart" + i);
    createChart(viewers[i], i);
}
%>
<!DOCTYPE html>
<html>
<head>
    <title>3D Shadow Mode</title>
    <!-- Include ChartDirector Javascript Library to support chart interactions -->
    <script type="text/javascript" src="cdjcv.js"></script>
</head>
<body style="margin:5px 0px 0px 5px">
    <div style="font:bold 18pt verdana;">
        3D Shadow Mode
    </div>
    <hr style="border:solid 1px #000080; background:#000080" />
    <div style="font:10pt verdana; margin-bottom:1.5em">
        <a href="viewsource.jsp?file=<%=request.getServletPath()%>">View Source Code</a>
    </div>
    <!-- ****** Here are the chart images ****** -->
    <%
        for (int i = 0; i < viewers.length; ++i) {
            out.write(viewers[i].renderHTML(response));
            out.write(" ");
        }
    %>
</body>
</html>
© 2021 Advanced Software Engineering Limited. All rights reserved.